Highlight KPIs with Triangular Indicators V2
Product Description
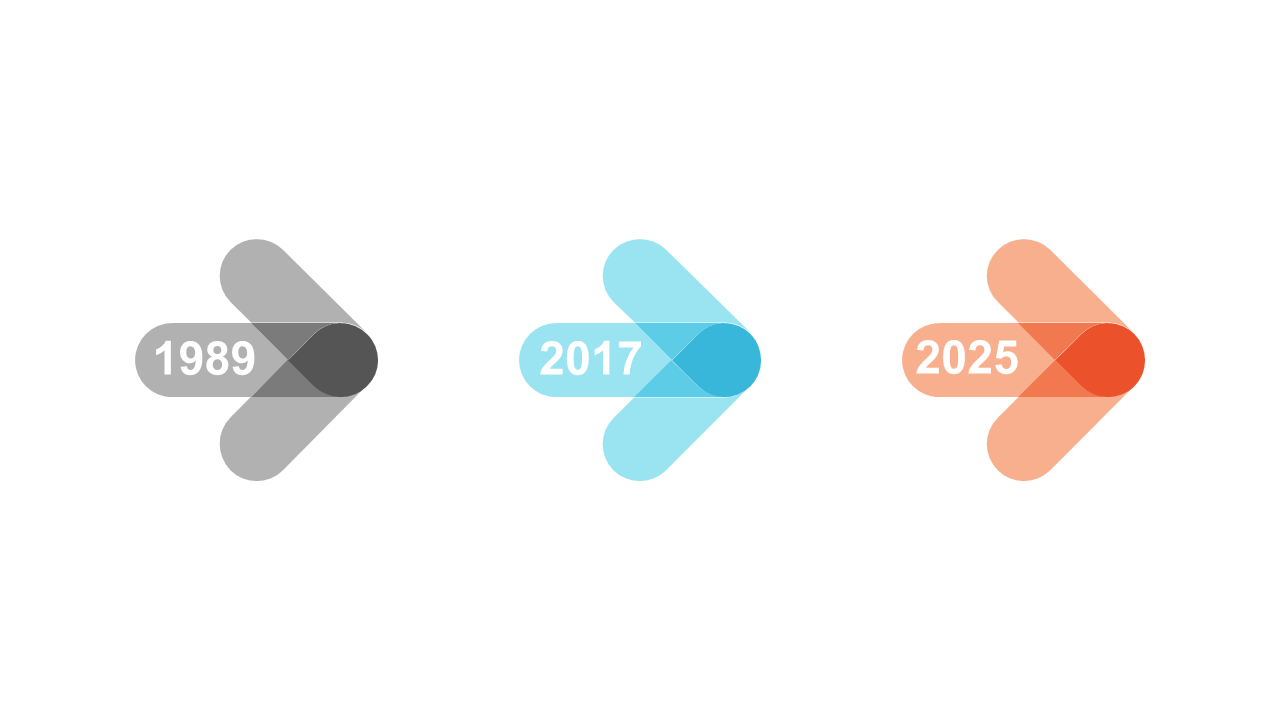
Presenting key performance indicators in an engaging way can be a challenge, especially when your audience needs clarity. This slide offers three triangular indicators that highlight essential metrics in a straightforward, visually appealing manner. It’s designed to help you convey complex information without overwhelming your viewers.
Operations managers, project leads, and department heads will appreciate the effectiveness of this slide for their presentations. Whether you’re summarizing project outcomes, discussing operational efficiency, or reporting on team performance, these indicators provide a clear visual snapshot of your KPIs.
It’s perfect for team meetings, performance reviews, or stakeholder updates. For just $0.99, you can download this slide instantly and customize it easily in both PowerPoint and Google Slides. It’s designed to save you time while ensuring your presentation looks polished and professional in minutes.
$0.99 – Purchase Checkout
Added to cart