Compare Metrics with Pentagon Percentage Chart
Product Description
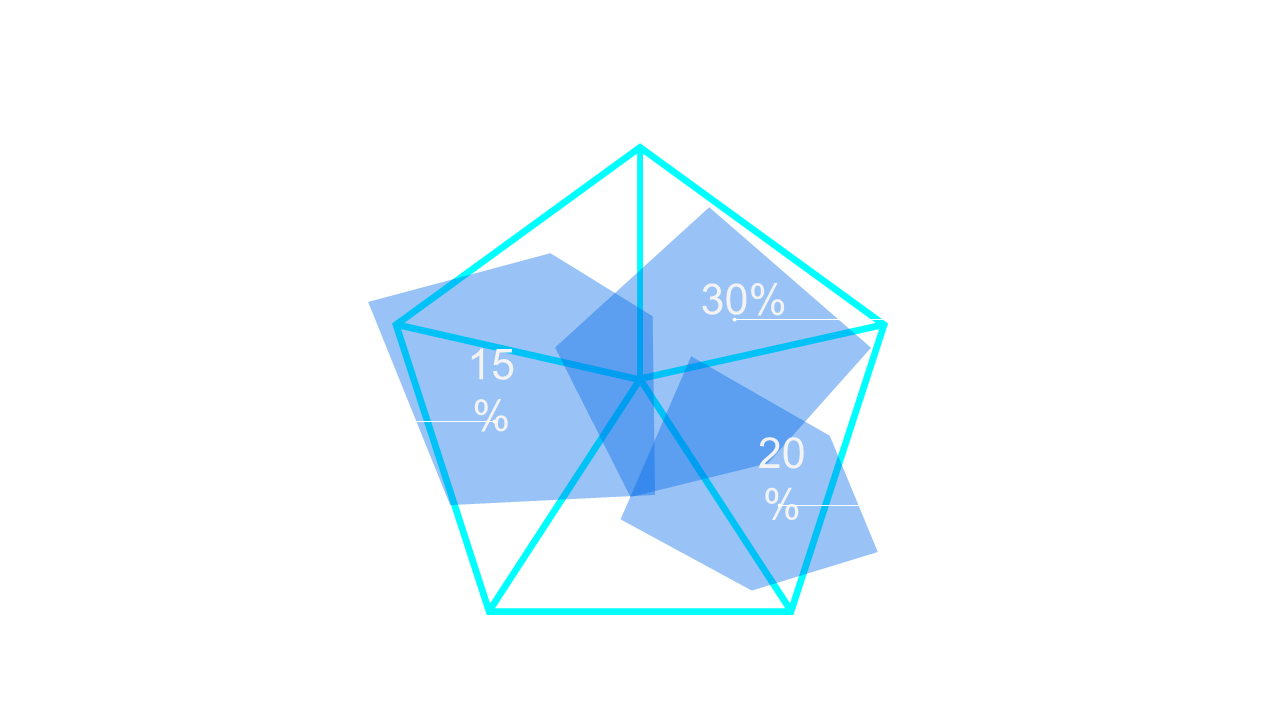
Communicating multiple metrics can be a daunting task, especially when clarity is essential for decision-making. The Pentagon Percentage Chart simplifies this challenge by offering distinct segments that highlight each value, allowing your audience to grasp complex data at a glance.
This slide is perfect for data analysts working in finance or marketing who need to present quarterly performance metrics during executive meetings. It’s also useful for project managers leading review sessions where tracking KPIs is key to the team’s success.
For just $0.99, you’ll receive a download that’s ready for your presentation needs. Easily edit the slide in PowerPoint or Google Slides to tailor it for your specific metrics in minutes.
$0.99 – Purchase Checkout
Added to cart







