Analyze Trends with Multi-Year Area Chart
Product Description
Tracking trends over multiple years can often feel like a daunting task. You want to show how metrics have evolved without overwhelming your audience with data.
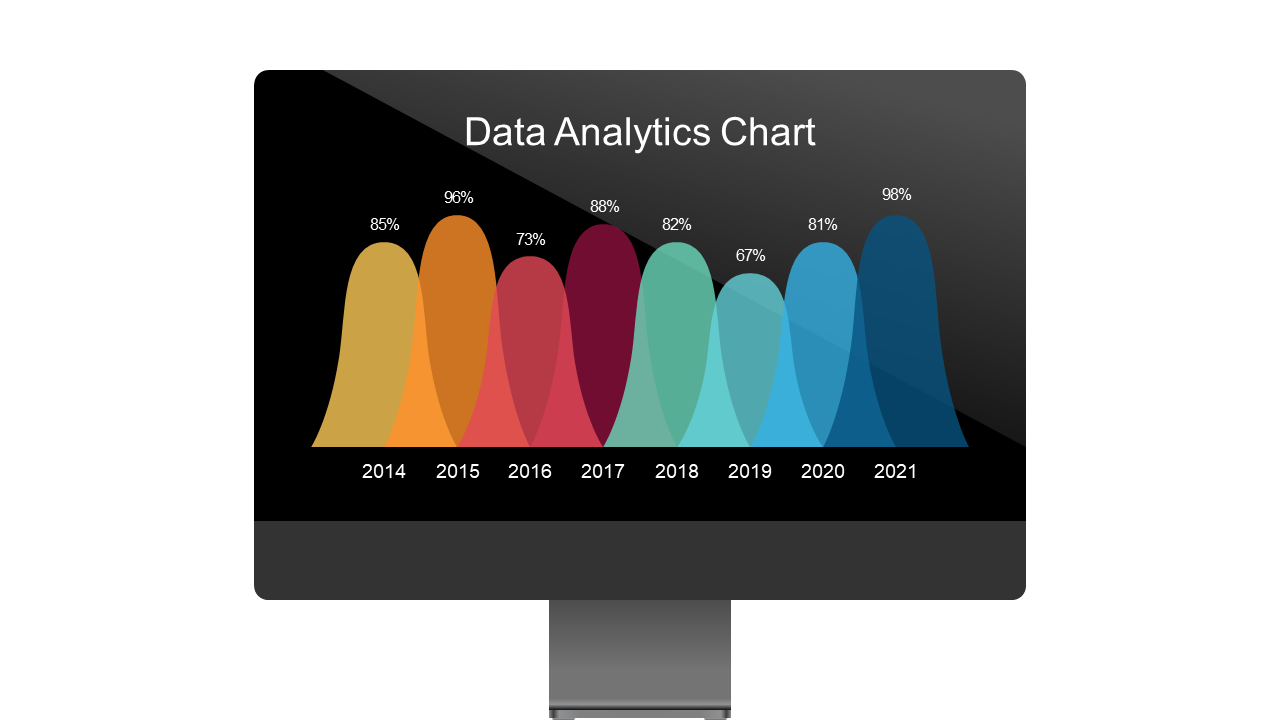
This multi-year area chart provides a clear and effective way to visualize trends over time, enabling your audience to easily identify patterns and shifts. Analysts in finance can use this slide to present historical data on revenue or expenses, marketing professionals can highlight the impact of campaigns over several years, and executives can share company performance trends in annual meetings. It’s the ideal tool for anyone who needs to make historical comparisons compelling and straightforward.
For only $0.99, you can download this slide immediately and customize it to fit your specific data needs in PowerPoint or Google Slides. Make your data tell a story by editing the colors and themes to match your branding in just a few clicks.
$0.99 – Purchase Checkout
Added to cart







