Visualize Market Segments by Percentage
Product Description
Presenting market segment data can often lead to misunderstandings if the information isn’t displayed clearly. If your audience can’t easily interpret the data, you risk losing their interest and failing to communicate key insights.
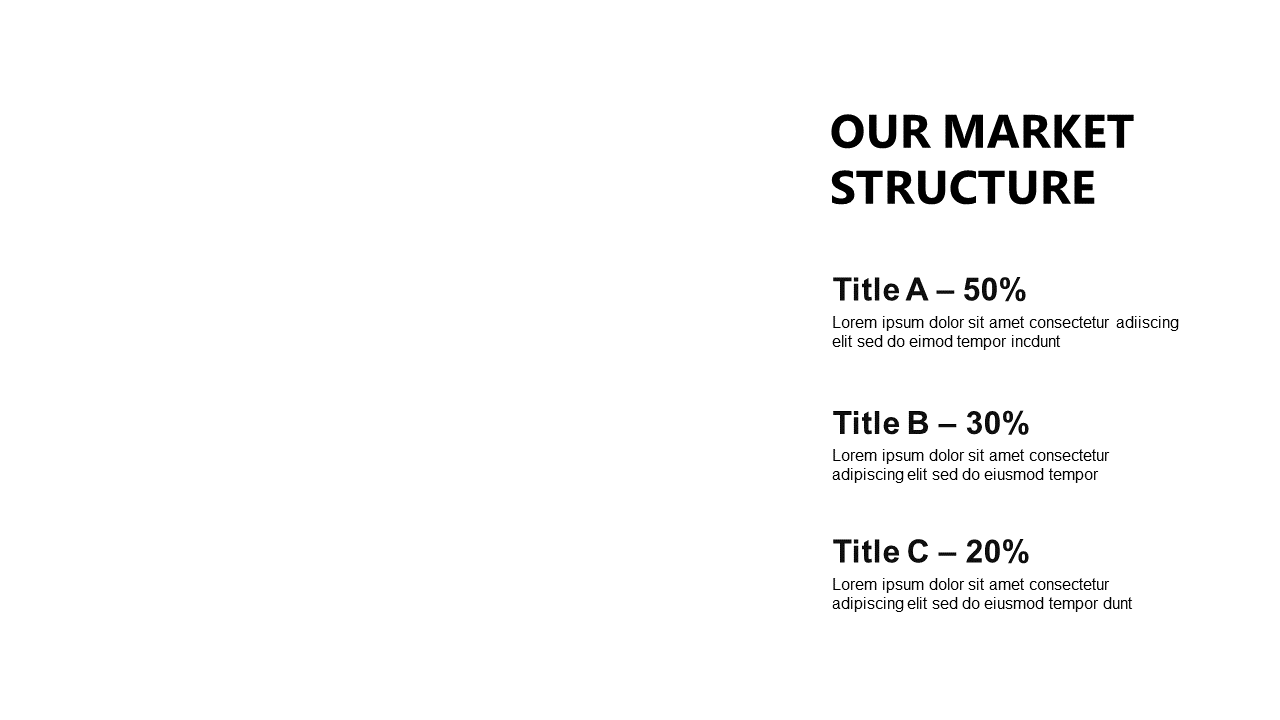
This slide offers a visual representation that simplifies complex market data, making it accessible at a glance. Data analysts and marketing professionals will find this slide essential during market research presentations or strategy discussions. Whether you’re breaking down your target audience for a new product launch or illustrating competitive analysis in a quarterly review, this slide clearly conveys the distribution of market segments in an engaging way.
For only $0.99, you can download this slide and customize it effortlessly in PowerPoint or Google Slides. It’s designed for easy editing so you can quickly adapt it to fit your data presentation needs, getting you ready to present in minutes.
$0.99 – Purchase Checkout
Added to cart







