Present Insights with Laptop and 3-Step Flow
Product Description
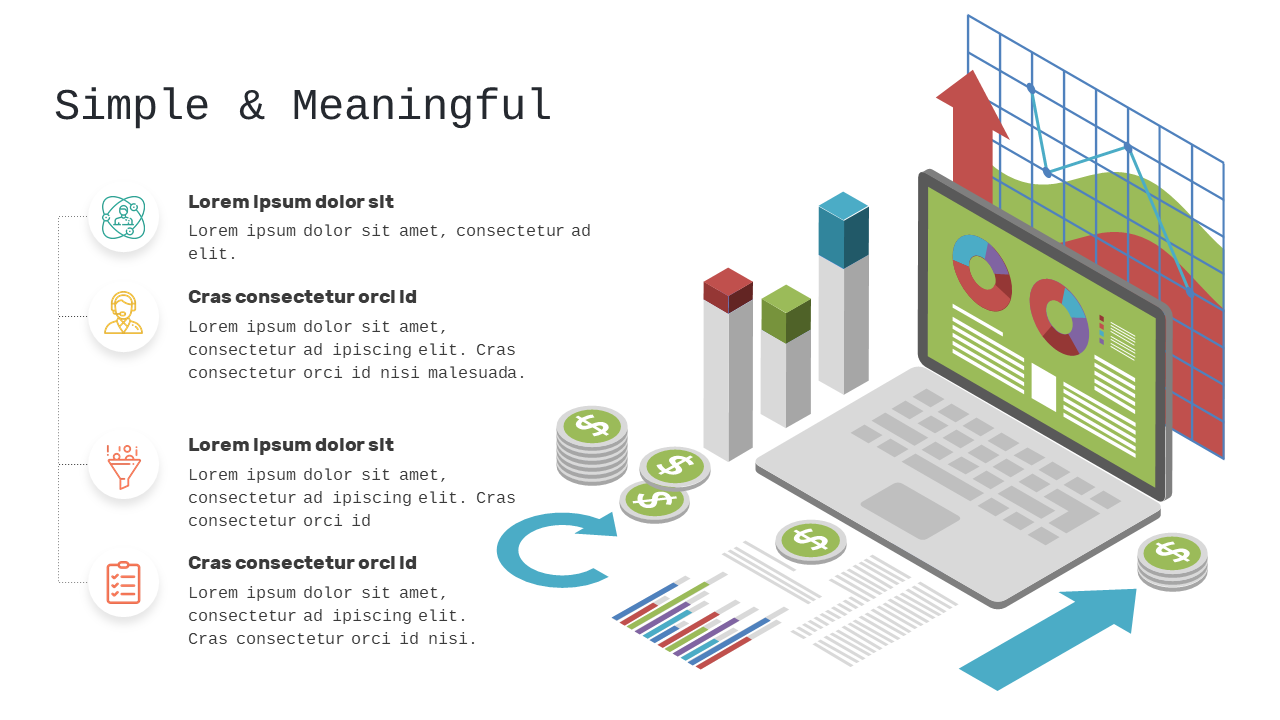
When you need to deliver insights under tight deadlines, ensuring clarity in your presentation is crucial. Complicated data can intimidate your audience and dilute your main points. This slide, featuring a laptop with a data visualization and a simple 3-step flow, guides your audience through your message without confusion.
Think about using this for sales forecasts, strategy presentations, or performance reviews. It’s perfect for data analysts, marketing professionals, or consultants who need to share key insights in an approachable manner.
The layout not only captures attention but also encourages engagement, making your points more memorable. For just $0.99, this slide is available for immediate download, and you can easily edit it in PowerPoint or Google Slides. Get ready to elevate your presentations and make your insights shine.
$0.99 – Purchase Checkout
Added to cart







