Track KPIs with Engaging Gauges and Overview
Product Description
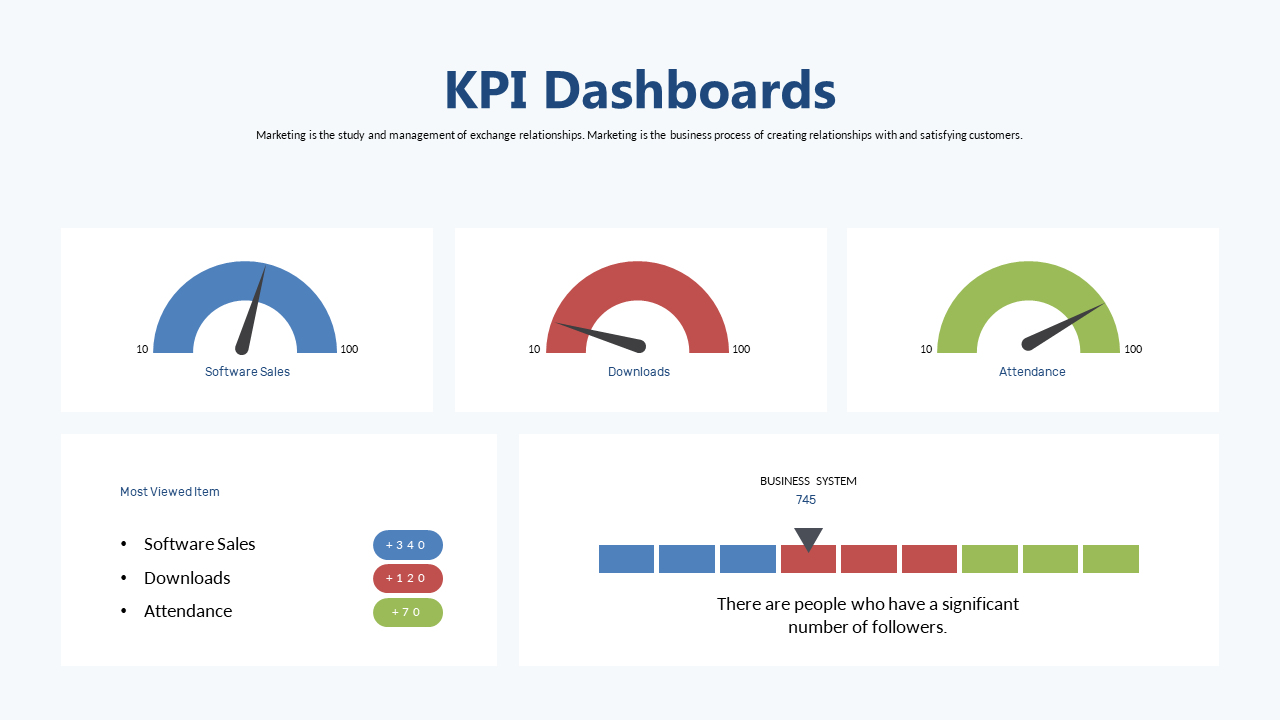
Keeping track of key performance indicators can feel overwhelming, especially when you are managing multiple metrics at once. You need a way to present your data that grabs attention while also being easy to understand. This engaging gauge slide provides a clear overview of your KPIs, making it simple to interpret results at a glance.
This slide is perfect for business analysts presenting data to stakeholders, marketing managers reporting campaign results, or sales directors monitoring team performance. Using it during team updates or performance reviews can help everyone stay focused on the metrics that matter.
For just $0.99, this slide is available for instant download and is fully editable in PowerPoint and Google Slides.
You can customize it quickly to align with your specific metrics in just minutes.
$0.99 – Purchase Checkout
Added to cart