Financial Overview with Infographic Table
Product Description
When you’re faced with the task of presenting financial information, it’s essential to keep things clear and straightforward. Dense tables and complex graphs can easily confuse your audience, leaving them with more questions than answers.
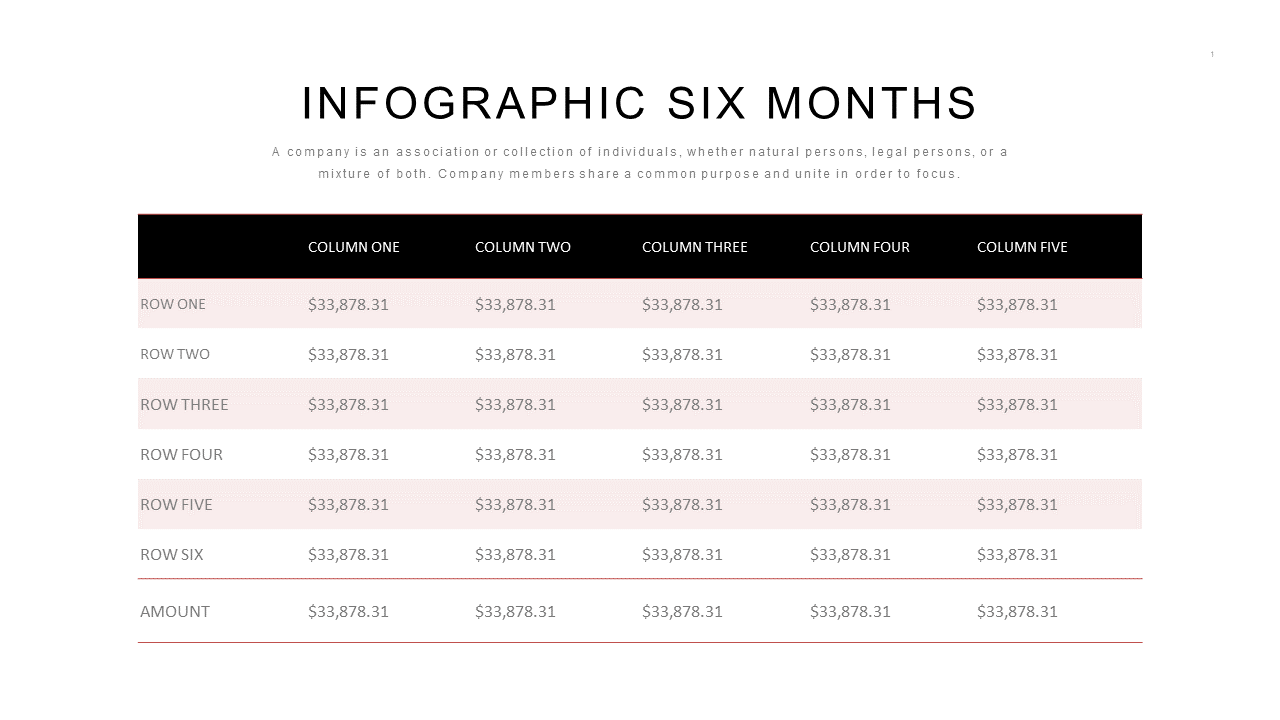
The infographic table slide organizes your data in a way that highlights key insights and promotes understanding, making it easier for viewers to engage with your content. This slide works wonders for finance teams delivering annual summaries, accountants detailing budget breakdowns, or managers preparing for strategic planning sessions. By presenting financial data through this structured layout, you can ensure that everyone in the room leaves with a solid grasp of your essential points.
Download this slide for just $0.99 and start customizing it in minutes. Whether you’re working in PowerPoint or Google Slides, this editable format will help you deliver a clear and effective financial overview to your audience.
$0.99 – Purchase Checkout
Added to cart







