Compare Attributes with Icon-Based Comparison Table
Product Description
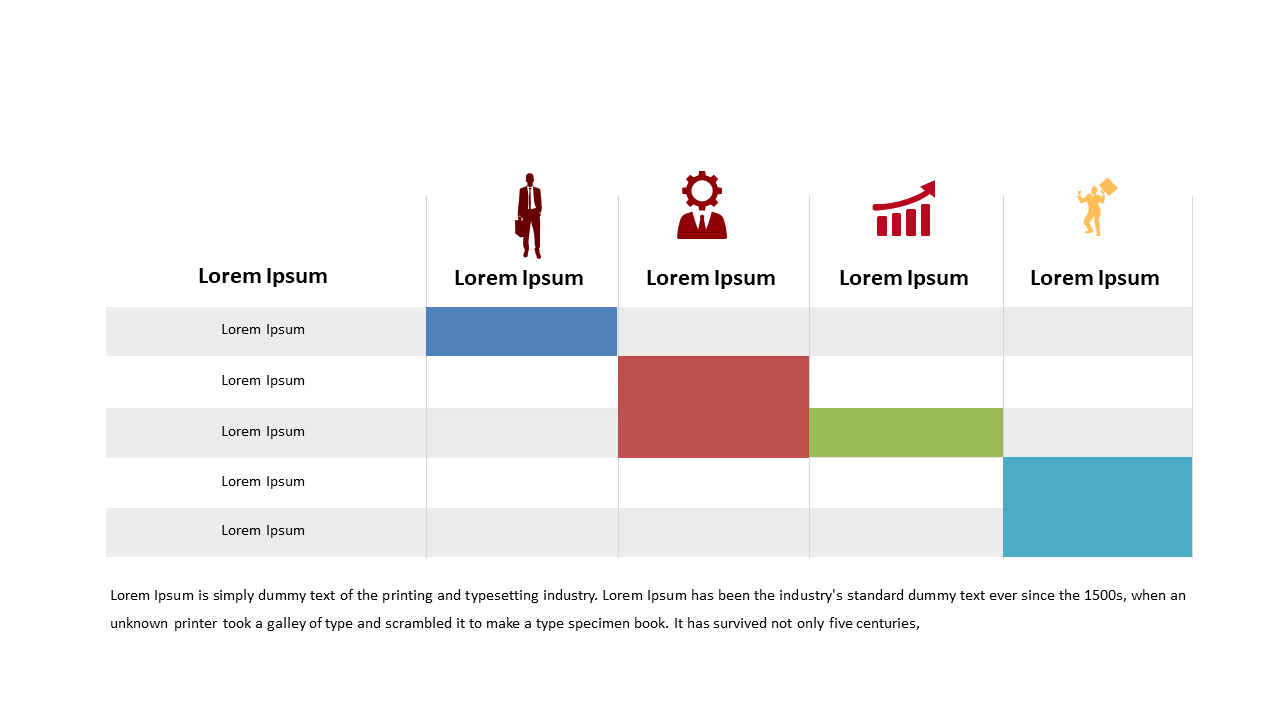
In a world where decisions are made quickly, comparing attributes clearly is essential, yet challenging. You need a way to present information that allows your audience to grasp key differences in an efficient manner.
This icon-based comparison table simplifies the process, making it easy to visualize distinctions at a glance. Perfect for project managers, product developers, and sales professionals, this slide suits scenarios like product comparisons, feature evaluations, or competitive analysis presentations. Whether you’re in a strategy session or client pitch, this table will help streamline discussions around choices and benefits.
Grab this slide for just $0.99, and you’ll get an editable template ready for PowerPoint or Google Slides. With quick customization, you can have it set up and ready for your presentation in mere minutes.
$0.99 – Purchase Checkout
Added to cart