Showcase Trends with Gradient Area Chart
Product Description
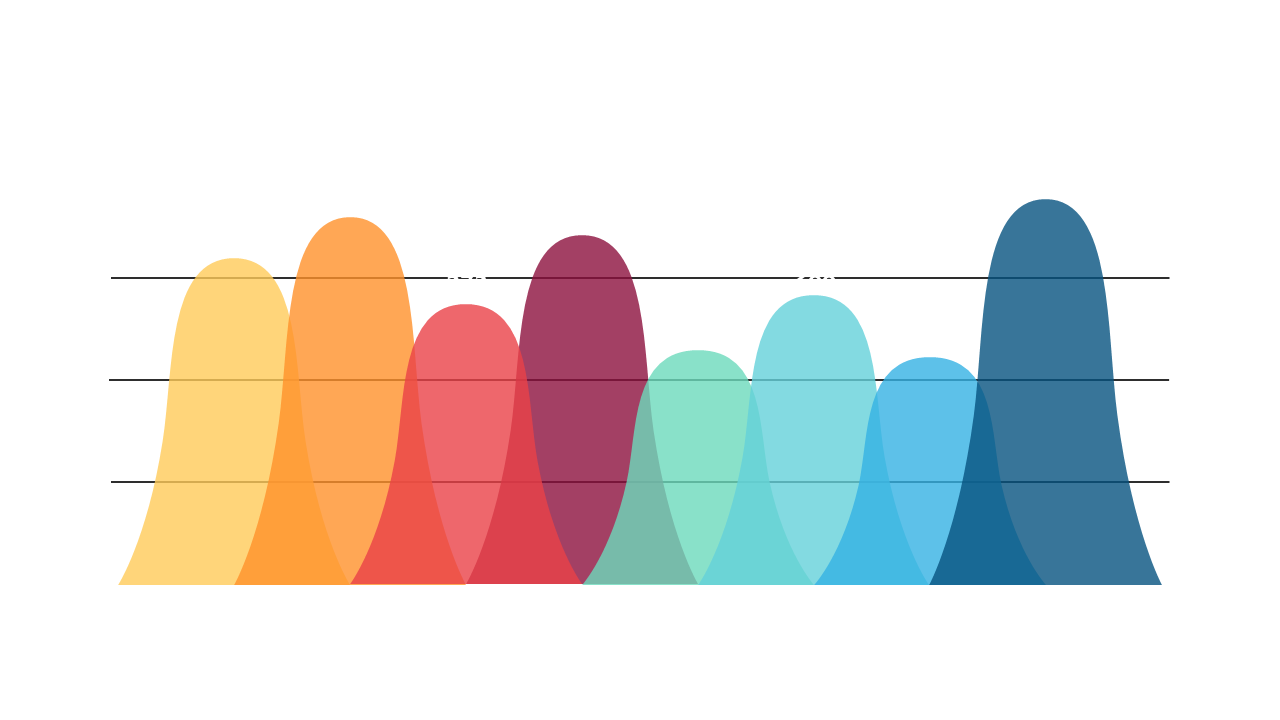
Communicating trends from complex datasets can often feel overwhelming, especially when your audience needs a clear narrative. The gradient area chart featured here offers a visually appealing way to highlight changes over time, making your message clearer and more engaging.
Data analysts and marketing professionals can particularly benefit from this slide when presenting quarterly sales figures or social media engagement trends in team meetings. It’s also perfect for finance experts showing revenue growth or decline in annual reports, helping to turn raw numbers into compelling stories.
For just $0.99, you can easily download this slide and customize it in PowerPoint or Google Slides. With the ability to edit colors and data points, you’ll have your presentation ready in minutes.
$0.99 – Purchase Checkout
Added to cart







