Visualize Data Over Time with Gradient Area Chart
Product Description
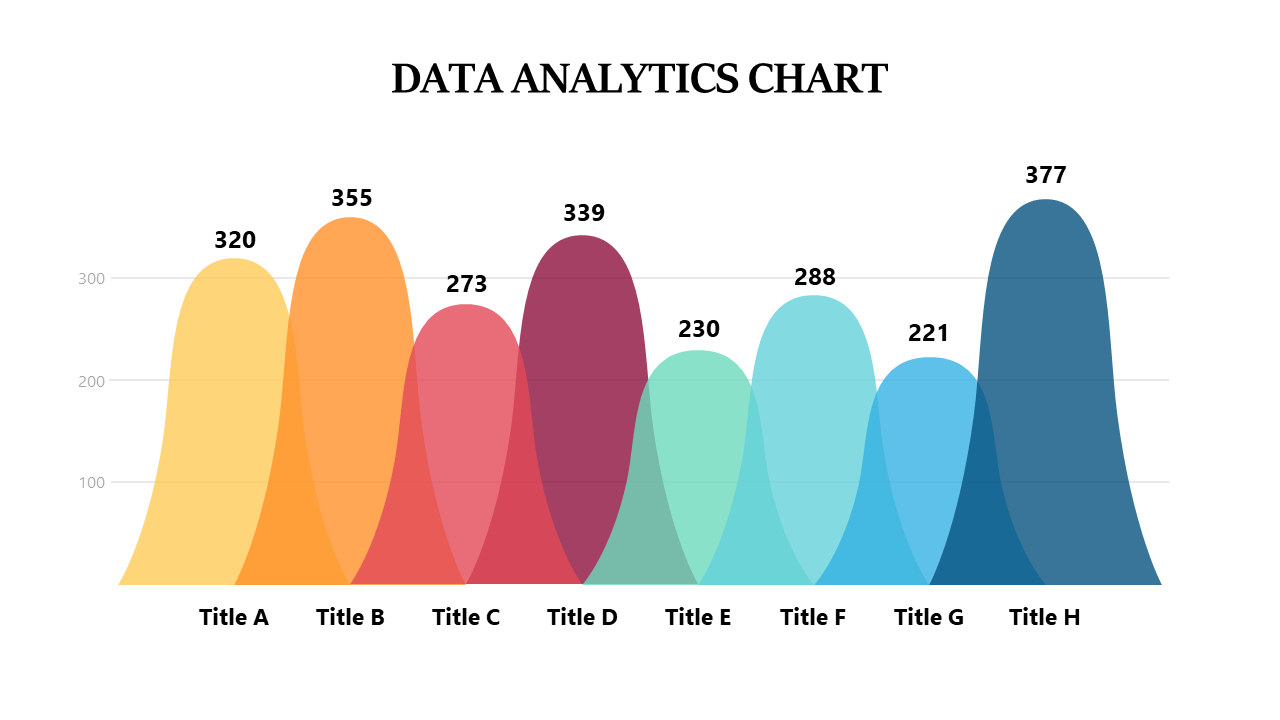
Trying to portray data trends effectively can be a daunting task, especially when faced with intricate information that needs to be understood quickly. This gradient area chart simplifies that challenge, allowing you to present data in a way that is not only clear but also visually attractive.
This slide works wonders for project managers during stakeholder presentations, where you need to visualize project timelines or resource allocation. It’s also useful for sales teams analyzing performance trends over multiple quarters, ensuring that everyone can easily follow along with the data being discussed.
At only $0.99, this slide is available for instant download and can be quickly edited in PowerPoint or Google Slides. Customize it to fit your needs, and you’ll be ready to present in no time.
$0.99 – Purchase Checkout
Added to cart







