Present Global Financial Data on World Map
Product Description
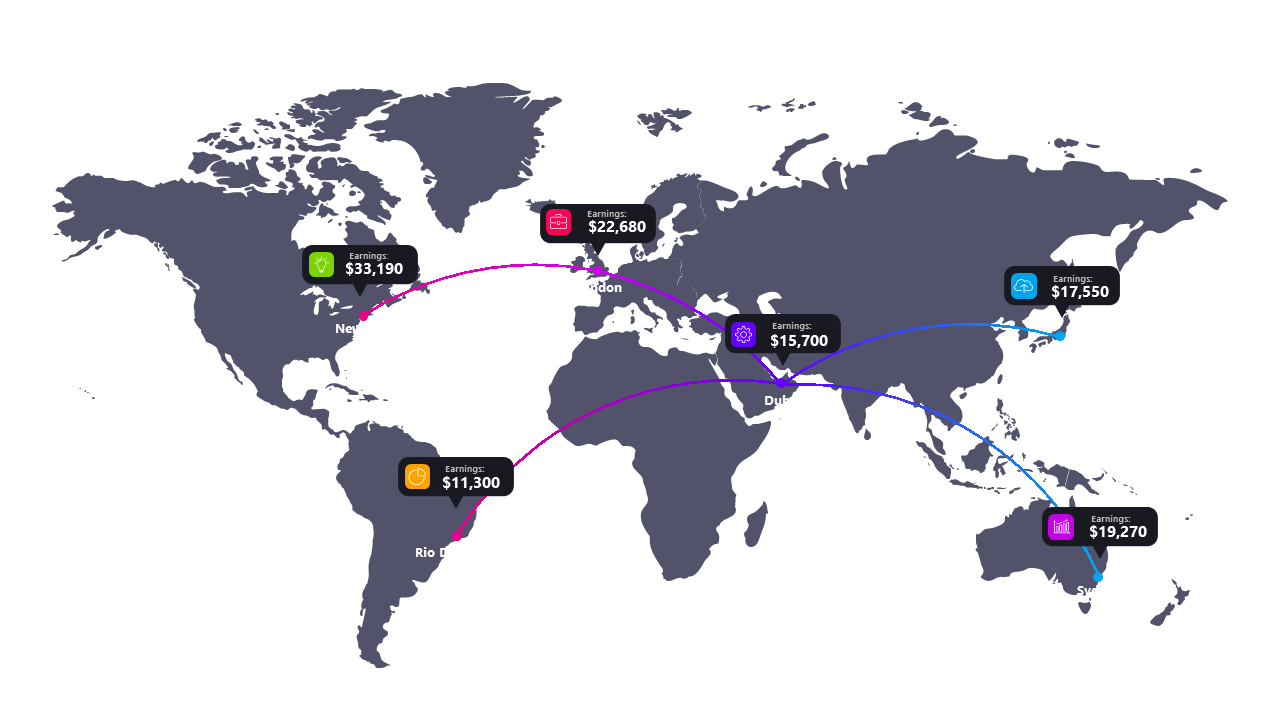
Presenting global financial data can be a challenge, especially when trying to capture a diverse audience’s attention. This world map layout effectively visualizes financial statistics across different regions, making complex information digestible.
Instead of staring at rows of data, your audience can see the global picture, enhancing their understanding of market dynamics. This slide is ideal for business professionals in international finance, market research, or consulting who need to convey geographic revenue insights. Imagine a financial consultant presenting a market analysis to potential investors or a corporate strategist discussing the impact of global market trends at a conference—this slide fits right in.
For only $0.99, you can download this world map slide today, ready for an instant edit in PowerPoint or Google Slides. Customize the data labels and colors to reflect your specific findings, ensuring your global insights are both clear and visually appealing in just minutes.
$0.99 – Purchase Checkout
Added to cart







