Present Global Financial Data on a World Map
Product Description
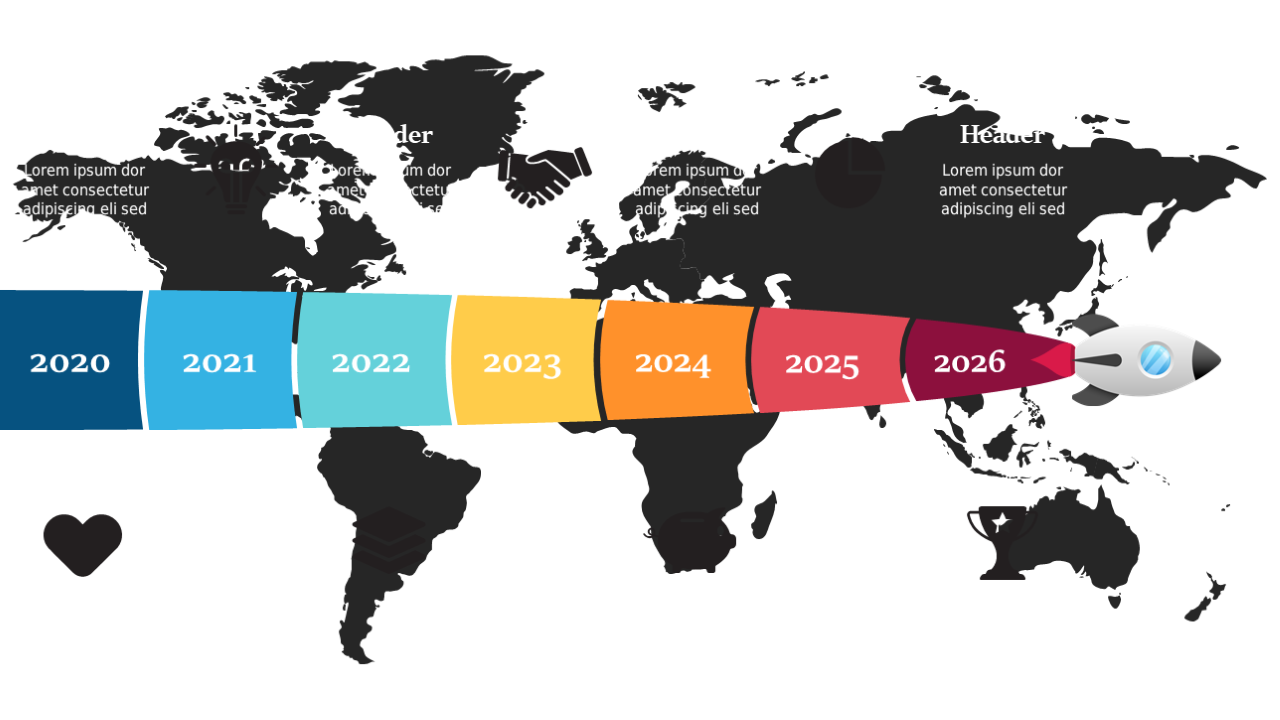
Presenting global financial data can be tricky, especially when you’re trying to convey insights that span multiple countries. If your audience struggles with interpreting numbers on a spreadsheet, this world map layout allows you to visually display financial statistics in a way that’s both engaging and easy to understand.
This slide is perfect for financial analysts, marketing executives, or international sales teams who need to showcase market analysis during presentations or board meetings. Imagine a product manager sharing revenue insights from different regions or a CFO discussing investment opportunities in various countries; this slide makes complex data accessible.
For just $0.99, you can download this slide and customize it in minutes. It’s easy to adjust the data labels and colors to fit your specific needs, and it works seamlessly in both PowerPoint and Google Slides.
$0.99 – Purchase Checkout
Added to cart







