Showcase Global Metrics with Editable Map
Product Description
Presenting global metrics shouldn’t be complicated, yet many find it challenging to convey their data clearly and effectively. Without a striking visual, your audience may overlook critical insights.
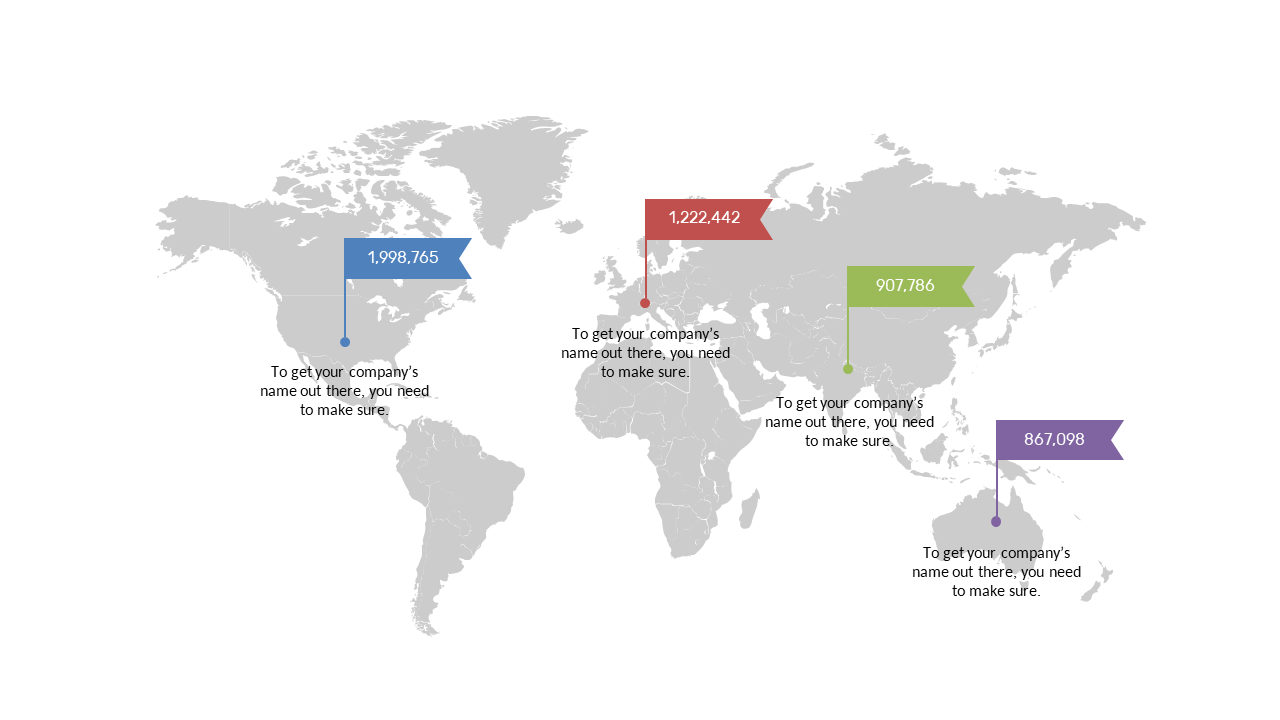
This slide features a detailed, editable world map that allows you to showcase important metrics in a straightforward manner. This slide is great for business analysts illustrating sales performance, project managers reporting on global initiatives, or finance professionals discussing international trends. Use it in presentations, reports, or strategy sessions to bring your global data to life and facilitate informed discussions.
For only $0.99, you can download this slide instantly and start editing it in PowerPoint or Google Slides. It’s designed for easy customization, enabling you to present your global metrics effectively in no time.
$0.99 – Purchase Checkout
Added to cart







