Present Data Distribution with Geographic Map V2
Product Description
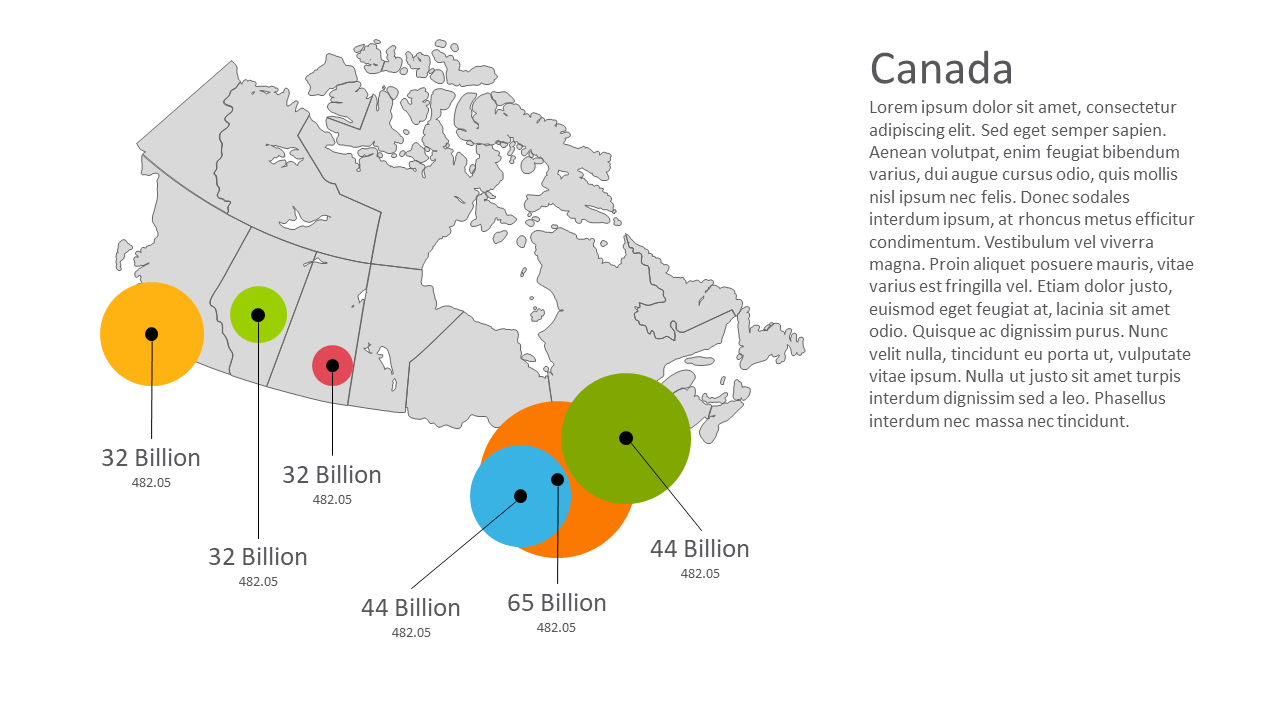
As a data analyst, presenting complex data can often lead to confusion among your audience, especially when it comes to geographic distributions. This slide simplifies that process with a detailed map of Canada, showcasing circles that represent varying data values for easy understanding at a glance.
This slide is ideal for data analysts discussing trends in market demographics, sales managers reviewing regional performance, or educators highlighting geographic data points in their lessons. Its visual appeal and clarity ensure your message is both engaging and effective.
Available for just $0.99, you can download this slide instantly and customize it in PowerPoint or Google Slides. It’s built for quick edits, so you can present your information confidently within minutes.
$0.99 – Purchase Checkout
Added to cart







