Visualize Data with Map and Bar Chart Layout
Product Description
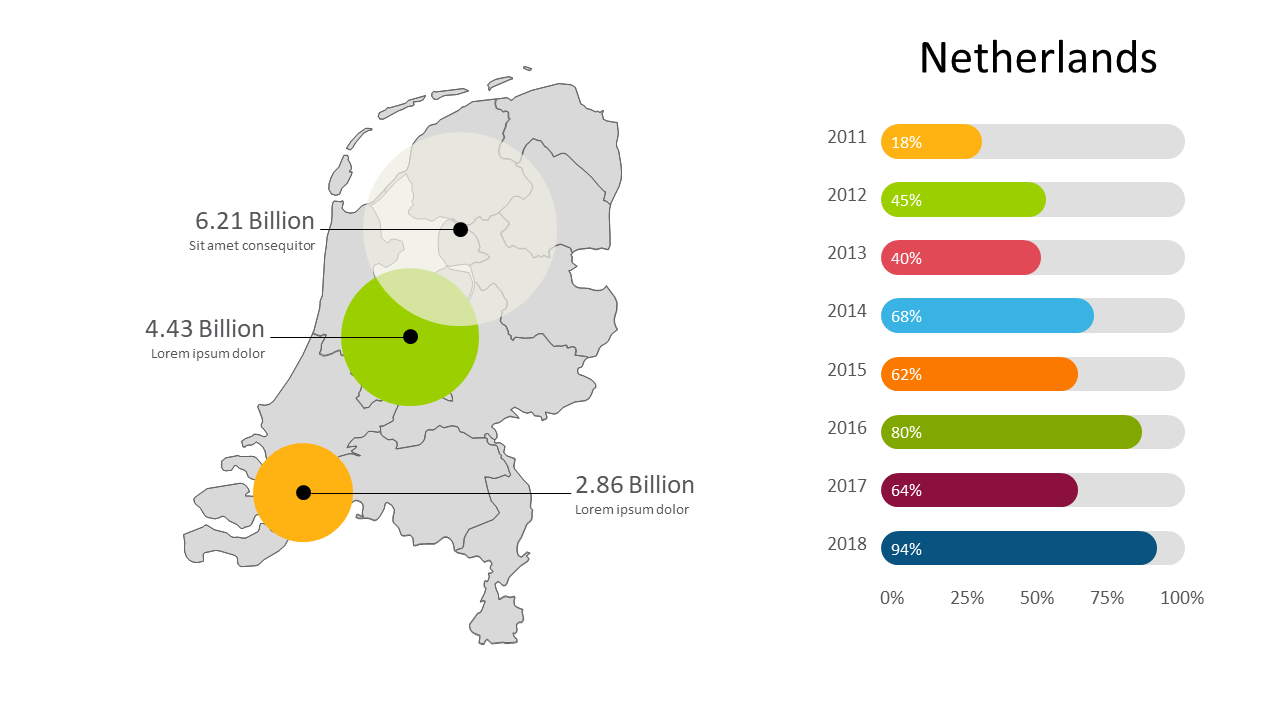
Conveying complex financial information quickly while keeping your audience engaged can be a real challenge. The combination of a detailed map of the Netherlands with an accompanying bar chart makes it easy to visualize key statistics and trends over time, ensuring clarity and comprehension for your viewers.
This slide is designed for finance leads, budget analysts, and business development teams who need to present insights during financial reviews, quarterly strategy meetings, or investment pitches. It’s particularly useful when you want to align data with geographical factors, allowing for a more engaging discussion around growth opportunities or performance metrics.
For just $0.99, this slide is available for instant download and is fully editable in PowerPoint and Google Slides. Your audience will appreciate the clarity, allowing you to focus on delivering the message effectively.
$0.99 – Purchase Checkout
Added to cart







