Compare Gender Representation with Icon Chart
Product Description
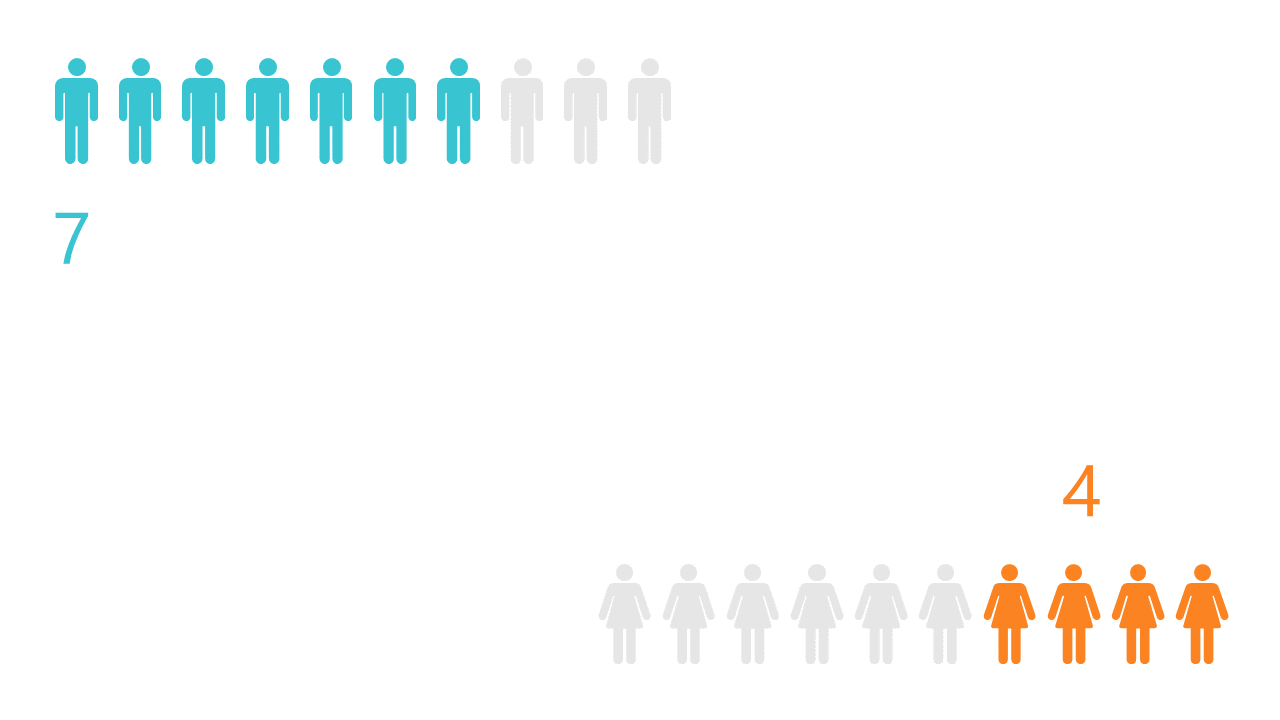
Translating gender representation into an easily digestible format is crucial for effective communication, especially in meetings filled with data. This icon chart layout provides a straightforward way to compare gender demographics quantitatively, helping your audience to quickly understand the makeup of a team or organization.
HR professionals, marketers, and team leads can use this slide during recruitment presentations, diversity discussions, or team composition reviews. By visually representing the data with iconic imagery, you’ll capture attention and convey your message more powerfully.
Available for just $0.99, this slide is an instant download, allowing you to make edits in PowerPoint or Google Slides with ease. Customize the icons and numbers to fit your specific needs and get your presentation ready in minutes.
$0.99 – Purchase Checkout
Added to cart







