Visualize Gender Comparisons with Progress Bars
Product Description
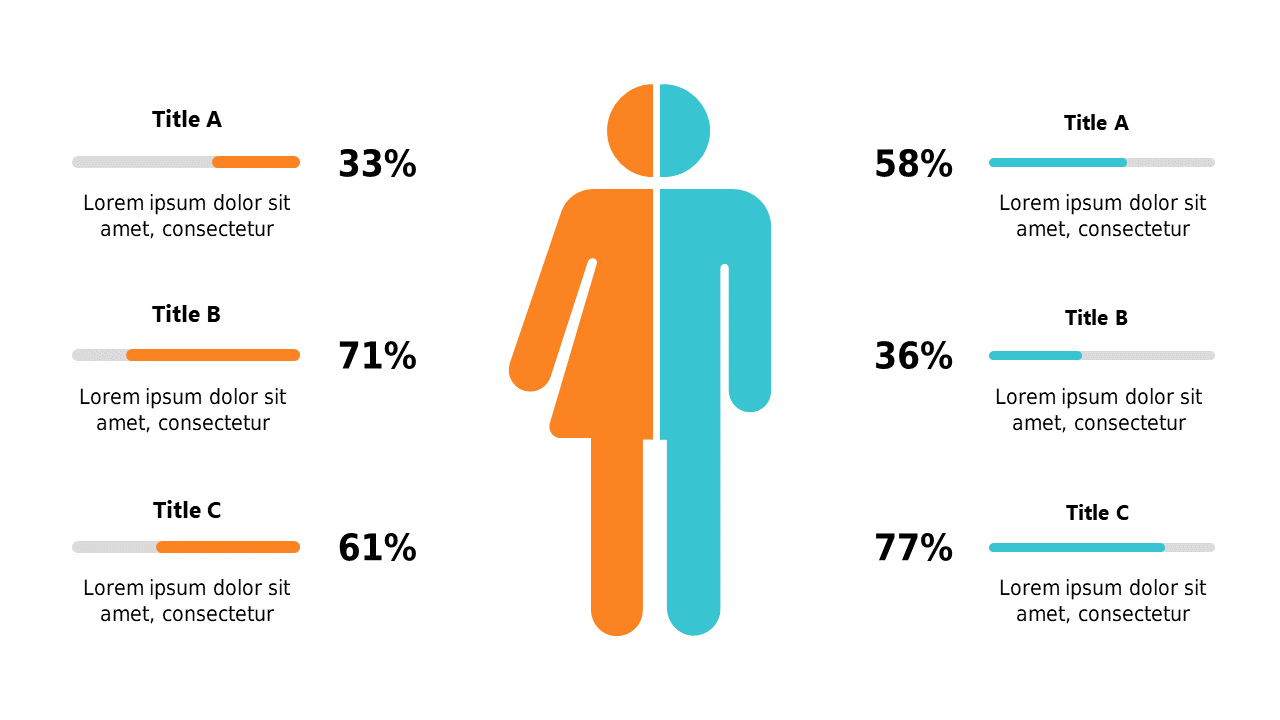
Communicating gender-related metrics can feel daunting, especially when you want to present clear comparisons without overwhelming your audience. You need a way to effectively show how different gender groups measure up against each other in a visual format that engages viewers.
This slide lets you showcase these statistics with striking progress bars that make the information pop. HR professionals conducting diversity and inclusion training, marketers preparing reports on gender demographics, or team leaders compiling performance reviews will find this slide incredibly useful. It’s designed to easily convey important gender statistics in meetings, workshops, or presentations where clarity is essential.
Available for only $0.99, this slide is an instant download that you can edit in both PowerPoint and Google Slides. Customize the text and percentages quickly to fit your needs and have an impactful visual ready in minutes.
$0.99 – Purchase Checkout
Added to cart







