Show Gender Comparisons with Progress Bars
Product Description
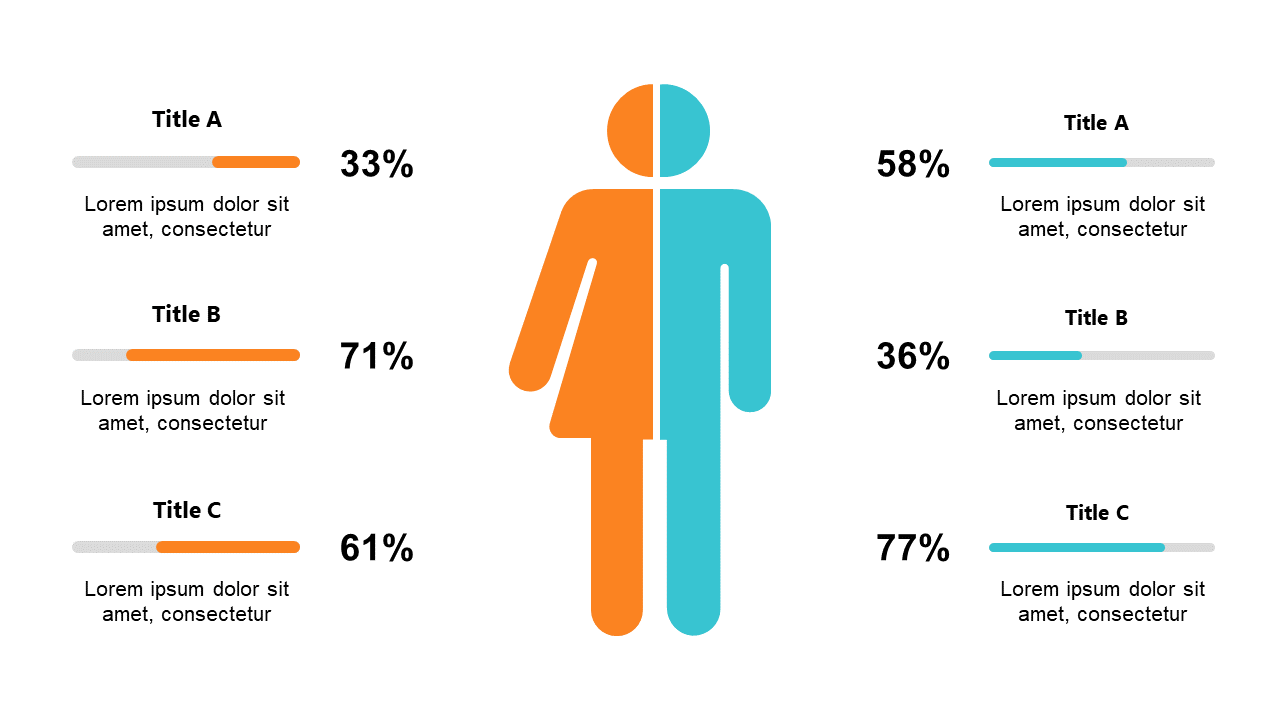
Finding an engaging way to depict gender comparisons can be a challenge, especially when statistics are involved. You want to present data in a way that’s not only informative but also visually appealing to maintain your audience’s attention.
This slide provides a straightforward layout that allows you to compare gender metrics using clear progress bars. This slide is perfect for HR specialists aiming to highlight gender diversity trends, marketing professionals analyzing customer demographics, or educators discussing gender equity in the workforce. It’s designed for scenarios where concise and effective data representation is key to making your point.
For just $0.99, you can download this slide and start editing it right away in PowerPoint or Google Slides. Tailor the details to your specific metrics and have a polished presentation ready in no time.
$0.99 – Purchase Checkout
Added to cart







