Showcase Gender Spending Insights with Graphs
Product Description
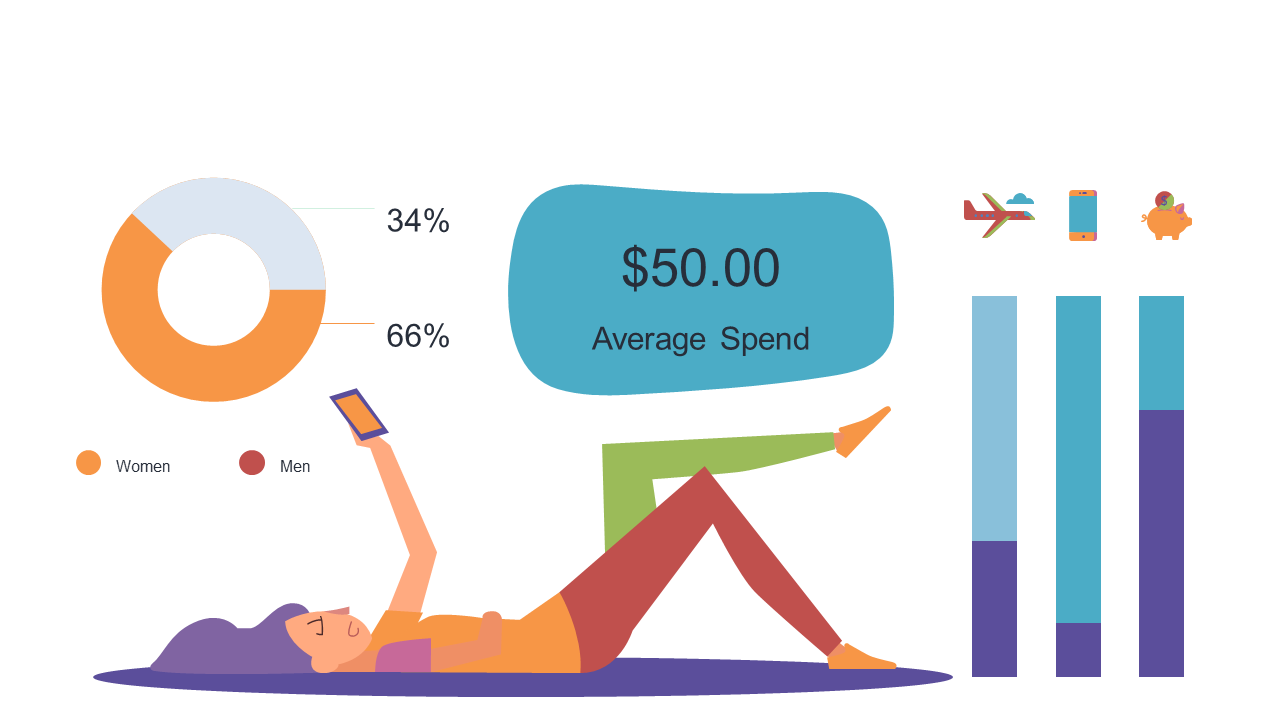
Communicating insights on gender spending trends can be a challenge, especially when data needs to be clear. This slide effectively combines pie charts and bar graphs to illustrate these trends visually, making it easier for your audience to understand the implications.
Say goodbye to complicated spreadsheets and hello to clean visuals. Business analysts and marketing professionals will find this slide useful for presentations that analyze consumer spending behavior. Whether you’re in a budget meeting or presenting to upper management, this slide will help you convey your findings with clarity.
Download this slide for only $0.99, and enjoy the benefits of an editable format that works flawlessly in both PowerPoint and Google Slides. You can tailor it to suit your branding in just minutes.
$0.99 – Purchase Checkout
Added to cart







