Present Florida Demographics with Pie Chart
Product Description
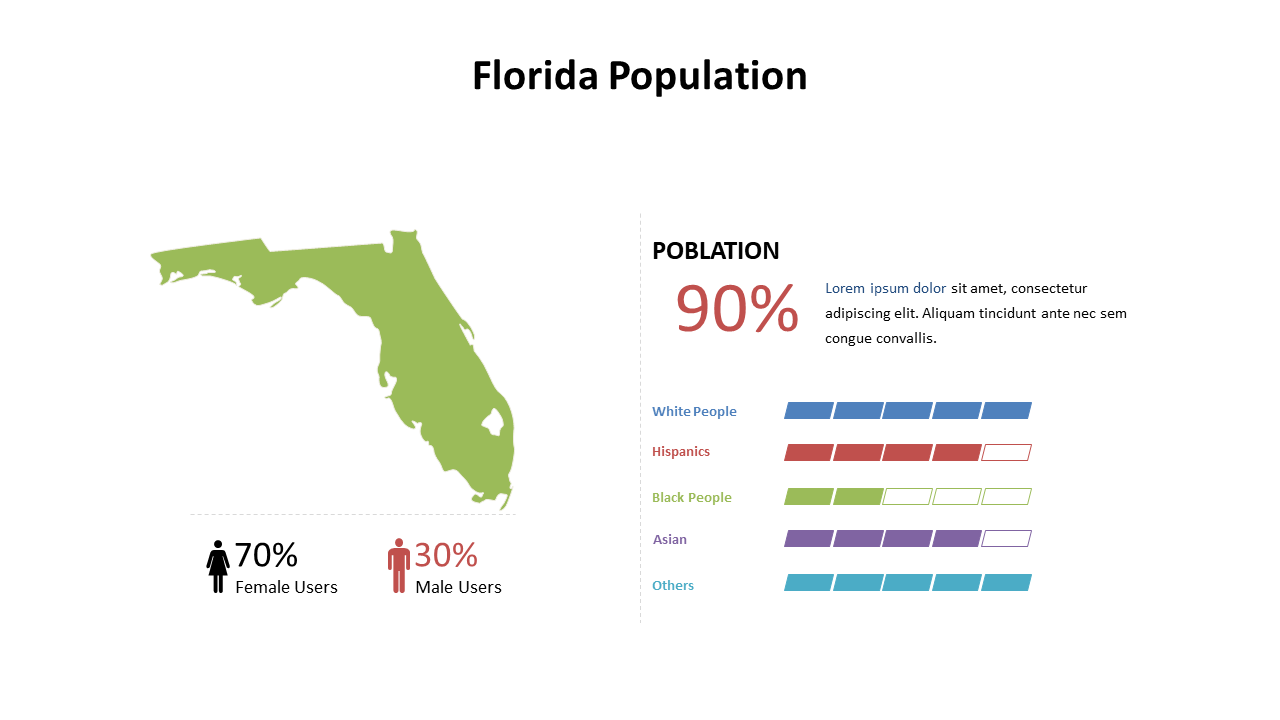
It can be tough to present demographic data in a compelling way, especially when time is short. This slide combines a pie chart with a state map of Florida, making it straightforward to communicate complex statistics and engage your audience effectively.
Great for marketing teams, event planners, and real estate professionals, this slide is useful during client meetings, community outreach presentations, or when drafting marketing strategies. The visually appealing pie chart helps you break down key demographics in an instantly digestible format.
For just $0.99, you can download this slide right away and edit it in PowerPoint or Google Slides. Make quick work of your demographic presentations while ensuring clarity and engagement.
$0.99 – Purchase Checkout
Added to cart







