Illustrate Epidemic Impact Across Europe
Product Description
In a time when every detail matters, showing the epidemic’s effects clearly can make all the difference. It’s essential to convey complex epidemic data without losing your audience in the details.
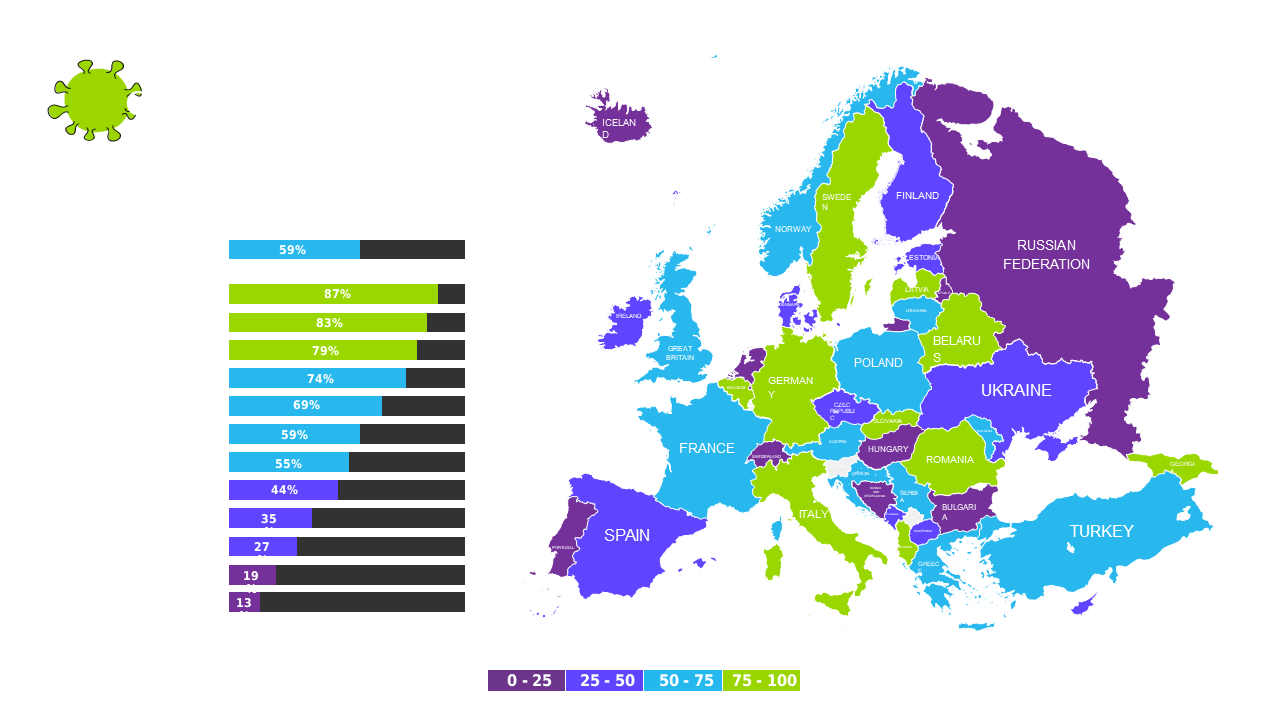
Healthcare analysts, public health officials, and community leaders can use this vibrant map of Europe in meetings focused on epidemic assessment and resource allocation. The accompanying side charts help simplify statistics, making your presentations more impactful as you discuss strategies for improvement and response.
You can grab this informative slide for just $0.99, and it’s ready to be edited in both PowerPoint and Google Slides. Instantly download it and make it your own within minutes to better inform your audience.
$0.99 – Purchase Checkout
Added to cart







