Present Epidemic Impact in Europe with Data Visualization
Product Description
Communicating the impact of an epidemic can feel daunting, particularly with dense data that requires clarity to resonate. You need a way to visualize the situation effectively so that your audience can grasp crucial insights quickly.
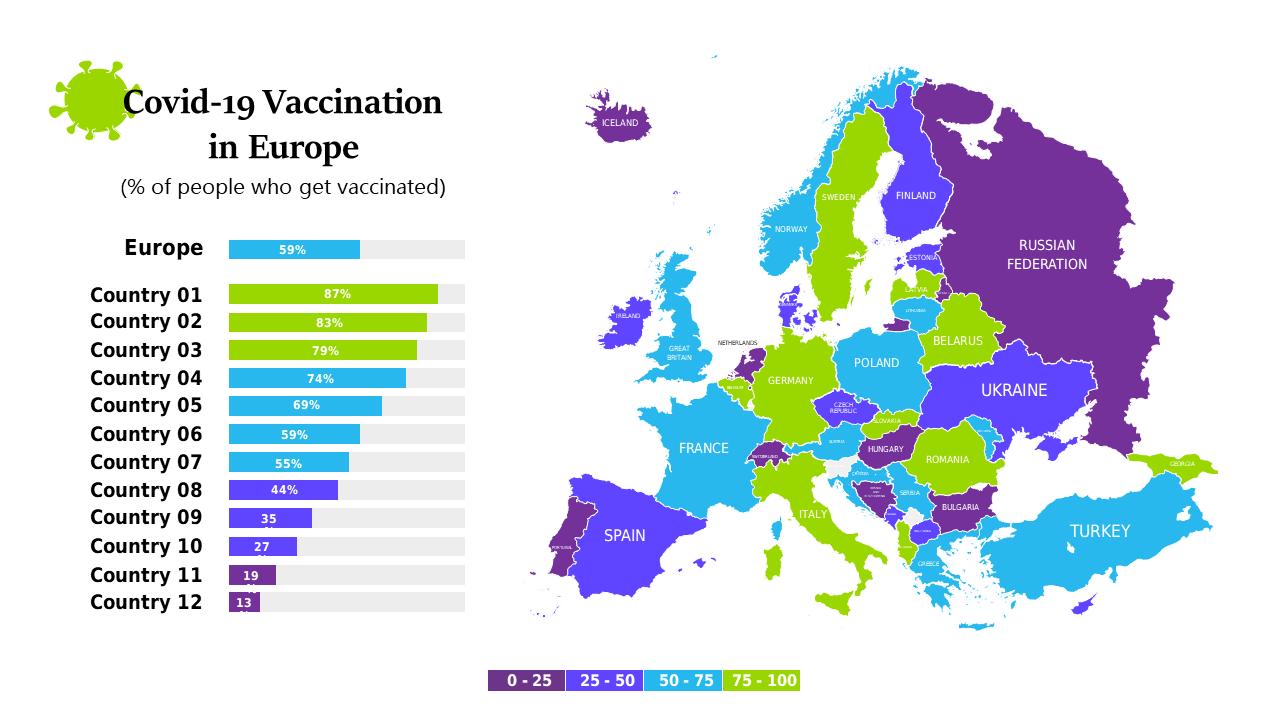
This slide is tailored for health professionals, academics, and policymakers who are presenting findings during conferences or strategy meetings. The colorful map and side charts provide an engaging way to highlight geographic disparities and relevant statistics, making complex information more digestible.
Download this eye-catching slide for only $0.99 and enjoy the convenience of editing it in both PowerPoint and Google Slides. You’ll have your data visualizations ready to share in no time.
$0.99 – Purchase Checkout
Added to cart







