Visualize Education Data with Bar Charts
Product Description
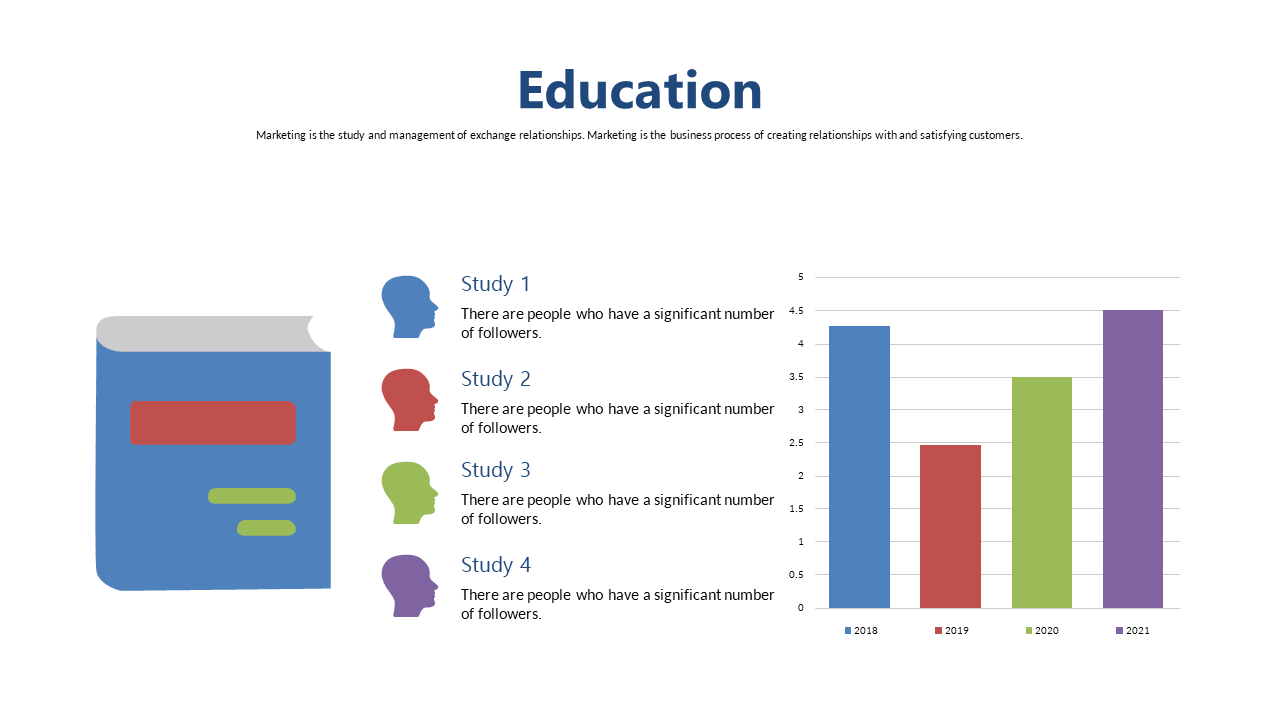
Illustrating complex educational data can feel overwhelming, especially when you want to ensure everyone understands your points. This slide transforms dense information into an easy-to-digest bar chart, making it simpler for your audience to grasp the key takeaways from your data.
Finance professionals, data analysts in educational organizations, or school leaders will find this slide essential when presenting results from studies or surveys. Imagine stepping into a staff meeting equipped with a clear and engaging visual that tells your story effectively, whether discussing funding outcomes or educational performance metrics.
Download this informative slide for just $0.99 and get instant access. It’s fully editable in both PowerPoint and Google Slides to ensure it aligns perfectly with your presentation style.
$0.99 – Purchase Checkout
Added to cart







