Visualize Comparative Metrics with Gears
Product Description
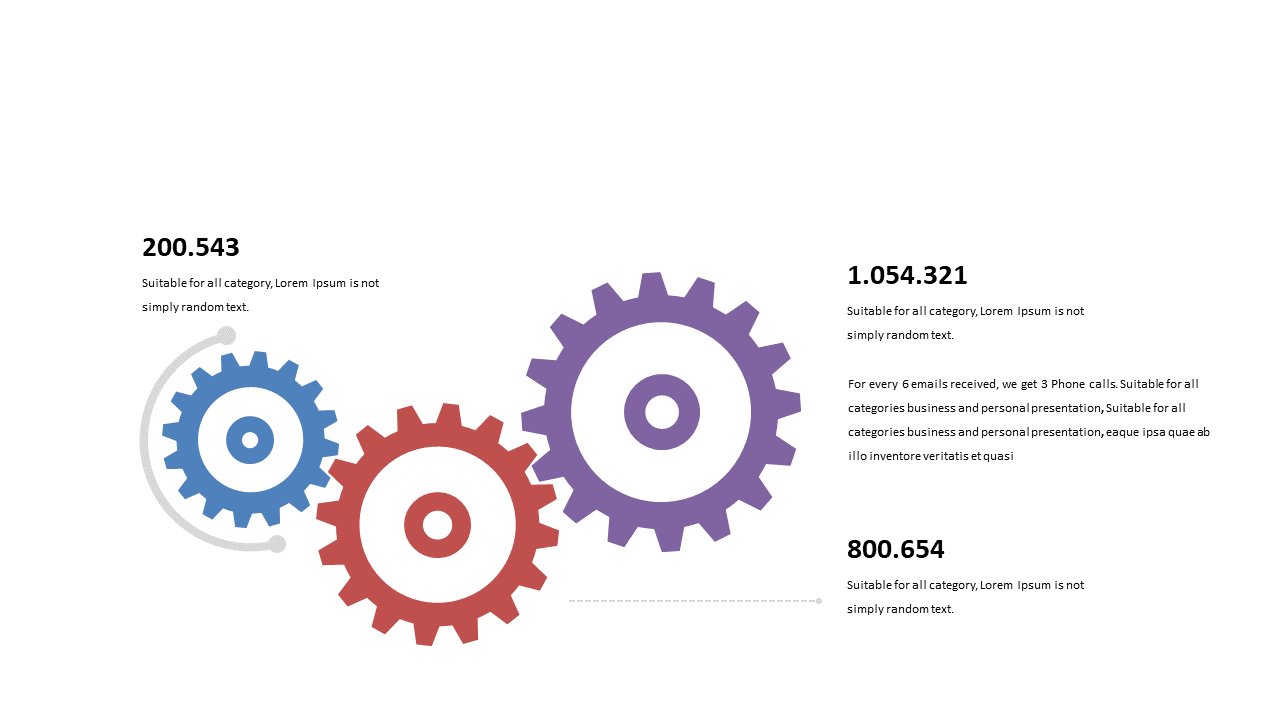
Communicating complex metrics can often feel overwhelming, especially when your audience needs to grasp intricate relationships quickly. This slide transforms the data into engaging interlocking gears, making comparisons not just clearer but also more visually appealing.
It’s the perfect way to simplify dense information for better comprehension. Data analysts, project managers, or team leads in tech companies can greatly benefit from this slide during presentations about performance metrics or project outcomes. Whether you’re in a quarterly review meeting or a strategic planning session, using this visual can help your audience understand how various metrics interconnect and impact overall success.
For just $0.99, you can instantly download this slide, which is fully editable in PowerPoint and Google Slides. Make your data presentations easier to digest and more engaging without the hassle.
$0.99 – Purchase Checkout
Added to cart







