Present Performance Metrics with Bar Chart
Product Description
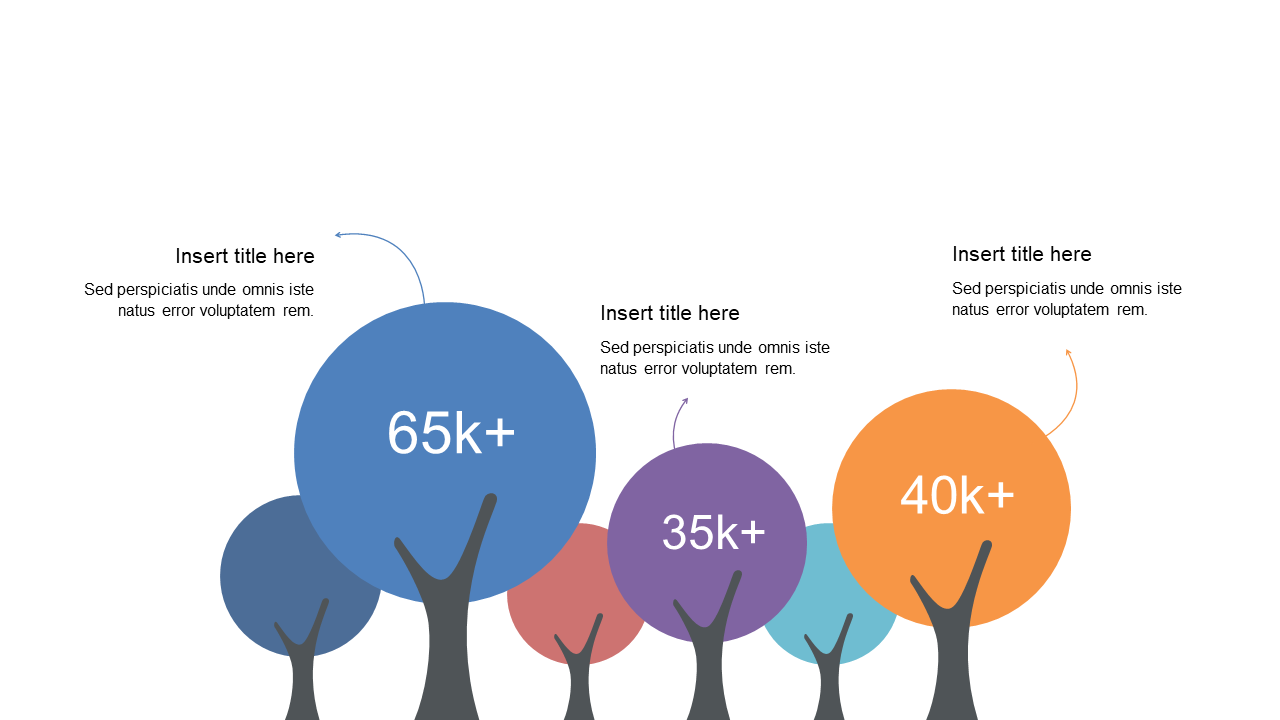
Conveying performance metrics to your team can often feel overwhelming, especially when you’re dealing with a lot of data. This slide simplifies that challenge with a clear bar chart that effectively visualizes your quantitative information, helping your audience absorb key takeaways without confusion.
It’s designed to help you present your insights with clarity and focus. Great for project managers presenting quarterly performance reviews or sales teams analyzing their monthly targets, this slide is perfect for anyone who needs to showcase data in an impactful way. Whether you’re in finance, marketing, or operations, this bar chart will keep your audience engaged and informed during meetings or presentations.
For just $0.99, you can quickly download this slide and start editing it to fit your needs. It’s compatible with both PowerPoint and Google Slides, making it easy to customize your data and have it ready in minutes.
$0.99 – Purchase Checkout
Added to cart







