Analyze Brands with Dashboard Infographics
Product Description
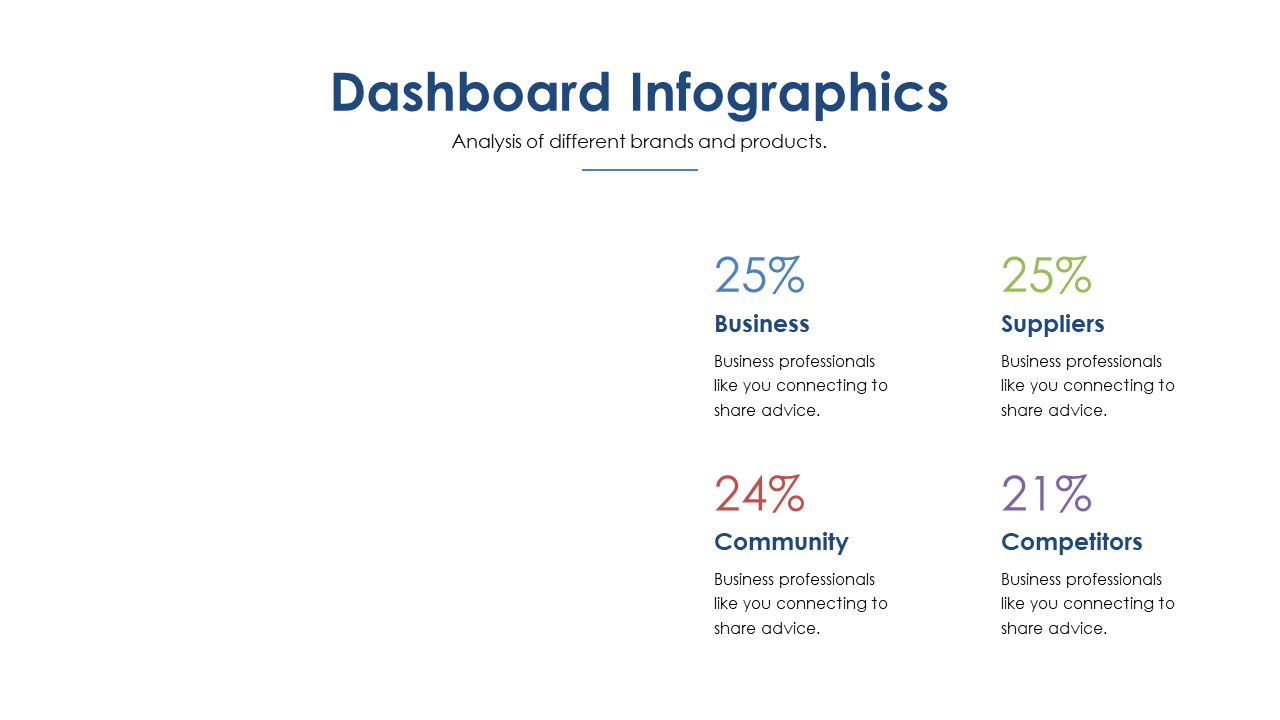
Navigating the complexities of brand analysis can be quite daunting, especially when you’re dealing with multiple products and market segments. If the data presentation is not clear, your audience may miss critical insights regarding brand performance. This dashboard infographic slide helps you visually dissect brand metrics, ensuring that your analysis is both comprehensive and understandable.
Market analysts, brand managers, and marketing directors can effectively use this slide in presentations, product strategy meetings, or competitive assessments. It allows you to highlight essential brand performance indicators in an engaging way.
A clean visual representation of varying segments enables clear communication and better decision-making. For just $0.99, this slide is available for instant download, and it’s easy to edit in both PowerPoint and Google Slides. You’ll be ready to impress your audience in no time, simply by customizing the slide to fit your specific needs.
$0.99 – Purchase Checkout
Added to cart







