Visualize Current vs Future States with KPIs
Product Description
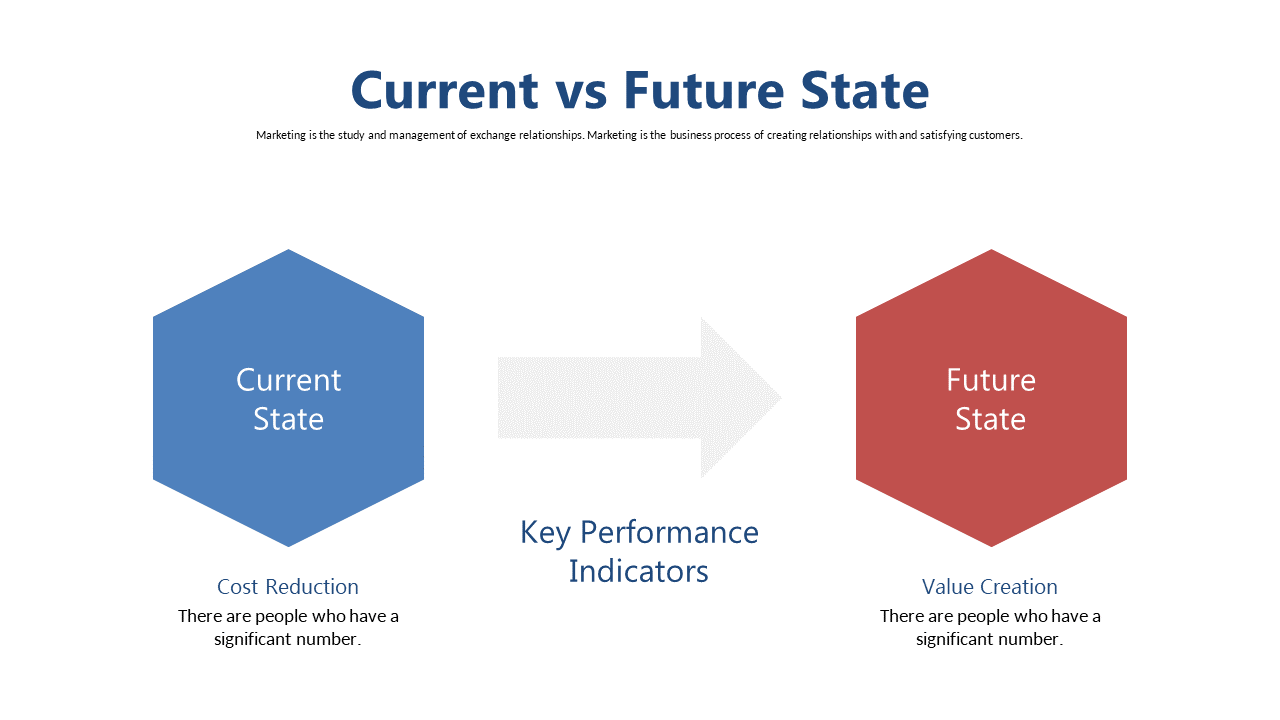
When you need to communicate the evolution of your business metrics, a clear visual representation can make all the difference. This slide helps you effectively showcase the stark contrasts between current and future states, ensuring your audience understands the trajectory you’re aiming for without getting lost in the details.
Ideal for financial analysts in quarterly reviews or marketing managers presenting campaign outcomes, this slide makes it easy to illustrate key performance indicators. Whether you’re updating the executive team or pitching to potential investors, these hexagonal designs highlight the metrics that matter most, grabbing attention and driving your message home.
Download this slide for just $0.99 and get instant access to a customizable format that works in PowerPoint or Google Slides. Editing is a breeze, so you’ll have your presentation ready in minutes.
$0.99 – Purchase Checkout
Added to cart