Analyze COVID-19 Vaccination Rates in South Korea
Product Description
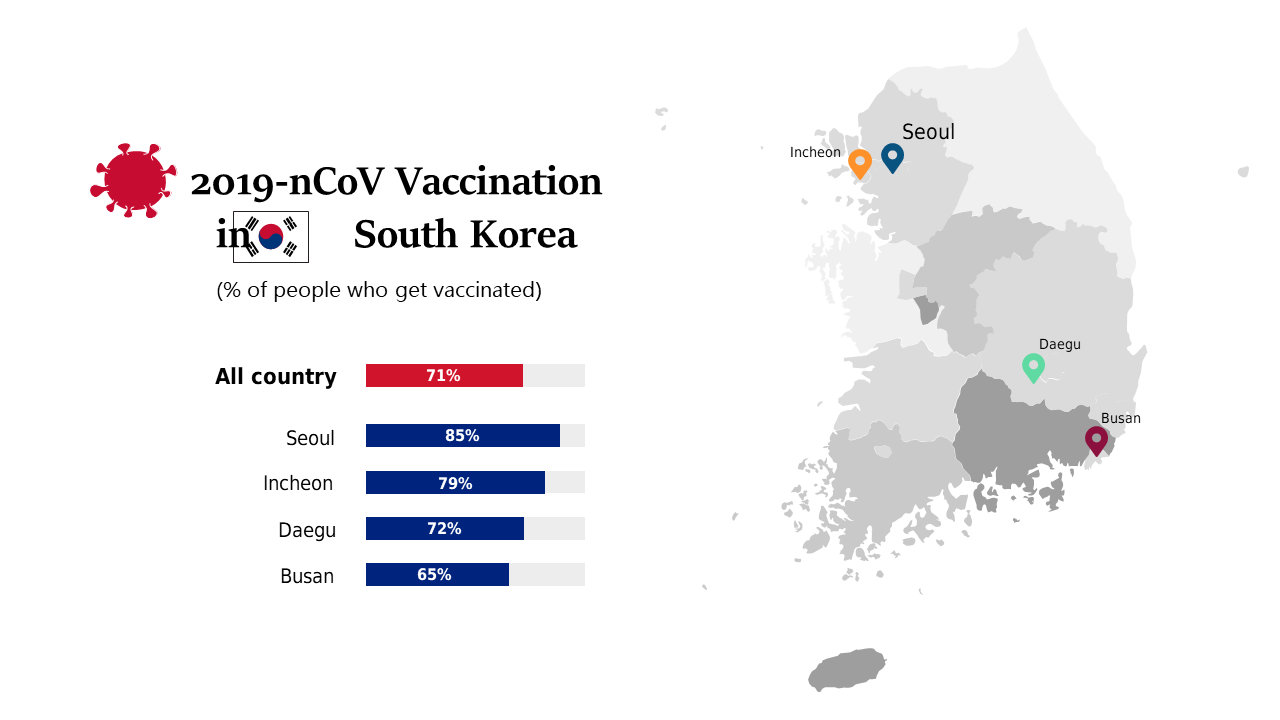
Presenting COVID-19 vaccination data can be overwhelming, especially when trying to compare different regions. This slide makes it simple by providing a clear map of South Korea with visual bars, allowing you to easily communicate important statistics.
Healthcare professionals, government officials, and researchers will find this slide useful during public health discussions or meetings focused on vaccination strategies and outcomes. It’s a great aid for anyone needing to present data or advocate for specific public health initiatives.
For just $0.99, you can download this slide instantly and customize it to match your presentation style in PowerPoint or Google Slides. Get your insights ready to share in a matter of minutes.
$0.99 – Purchase Checkout
Added to cart







