Present COVID-19 Infection Rates in Japan Effectively
Product Description
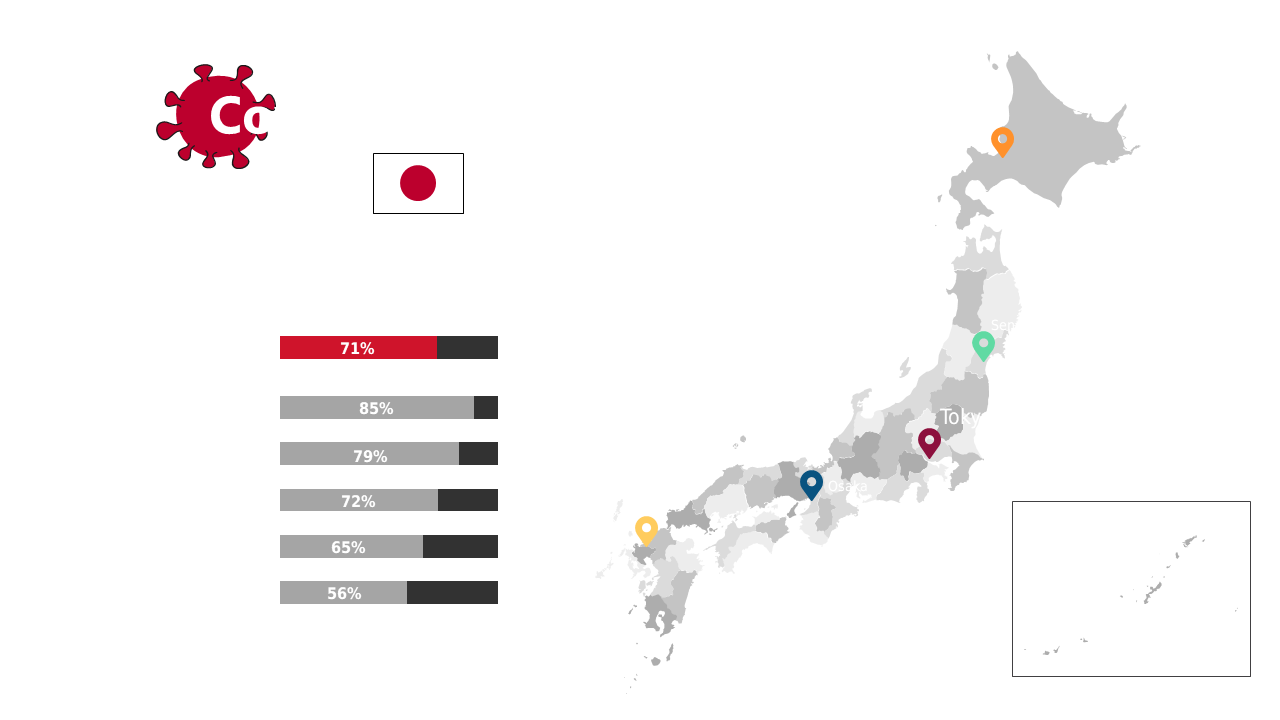
Summarizing COVID-19 infection rates can often lead to confusion if the data is not visually represented well. This slide effectively addresses that by providing a clean layout featuring a map of Japan alongside clear statistics, making your presentation straightforward and informative.
This is ideal for health professionals and analysts who need to convey critical epidemiological data during conferences, webinars, or team meetings. It’s particularly useful for those working in public health research, local government health departments, or educational settings where accurate data dissemination is essential.
You can download this slide for just $0.99 and have it ready to edit in PowerPoint or Google Slides within minutes. Tailor the statistics and visuals to reflect the latest research findings or your specific audience’s needs.
$0.99 – Purchase Checkout
Added to cart







