Compare Demographic Groups with Icons and Ratings
Product Description
Demonstrating demographic comparisons in an engaging way can often feel challenging, especially when you’re working with complex data sets. You want your audience to understand the differences at a glance without feeling overwhelmed.
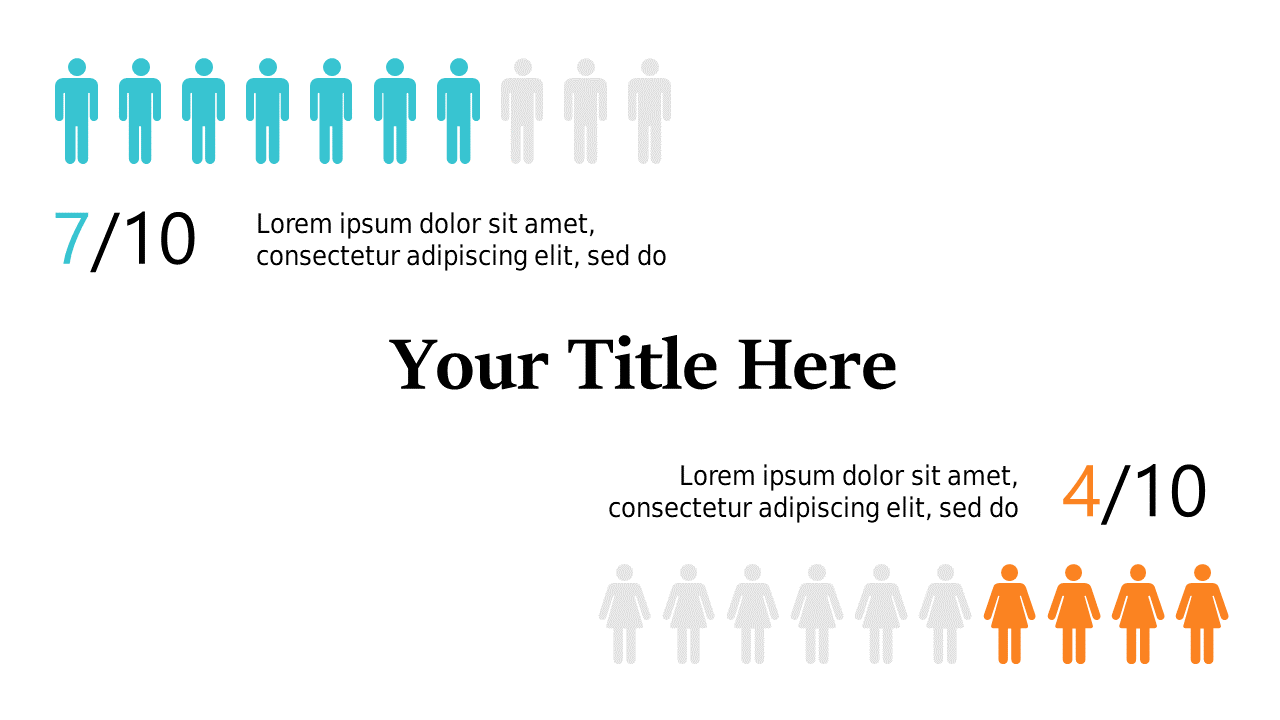
This slide uses icons and ratings to simplify demographic comparisons, making it easy for your viewers to grasp essential information quickly. Data analysts needing to present findings, marketing teams working on targeted outreach campaigns, or consultants preparing client presentations will find this slide particularly useful. It’s built for scenarios where you want to convey demographic insights clearly during discussions or presentations.
For the low price of $0.99, you can download this slide right away and tailor it to your specific needs. It’s compatible with both PowerPoint and Google Slides, allowing you to edit and customize it quickly for your upcoming presentations.
$0.99 – Purchase Checkout
Added to cart







