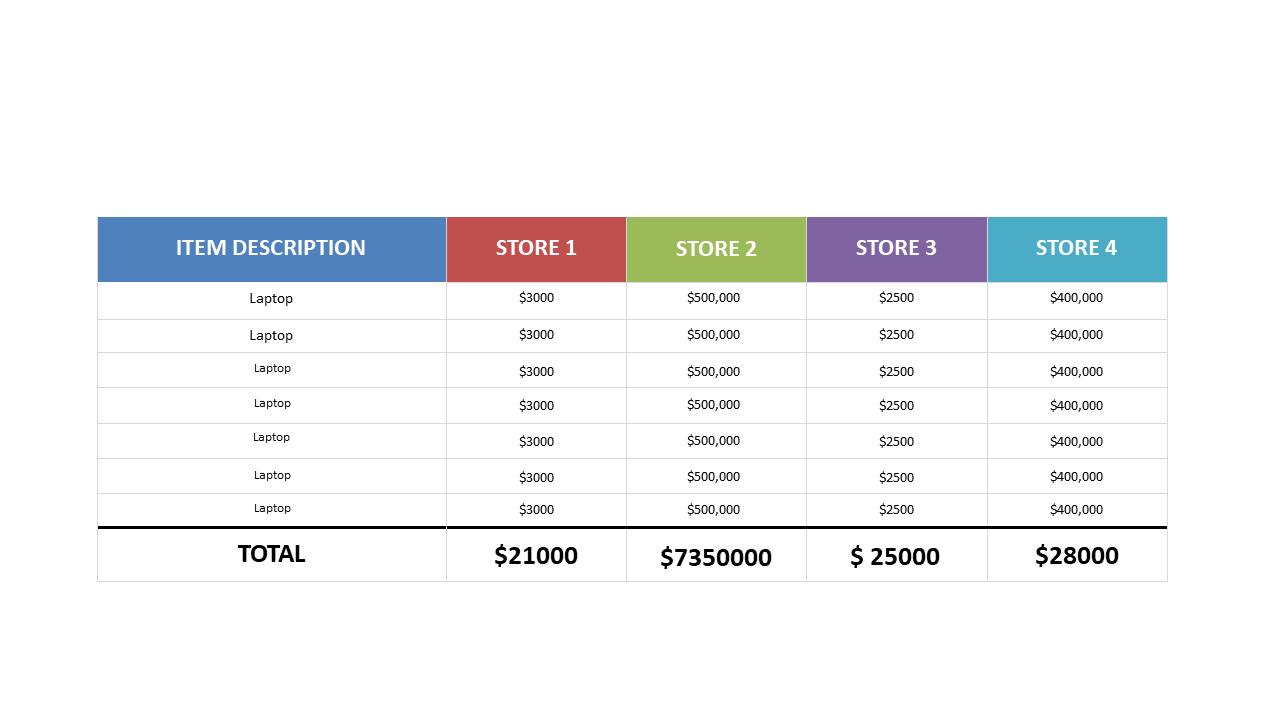
Compare Laptop Prices Across Stores in Table
Product Description
Finding the best laptop deal can be confusing, especially when prices vary widely across different stores. If you’ve ever felt frustrated trying to organize this information for decision-making, this table format is your solution. It allows you to visualize price differences easily, helping you or your audience make informed choices without the clutter.
This slide is great for tech buyers, purchasing agents, or anyone involved in procurement discussions. Use it in meetings to discuss budget allocations or for presenting to a team when evaluating hardware investments.
The straightforward layout makes it easy to highlight the best options available. For just $0.99, this slide is available for instant download and is fully editable in both PowerPoint and Google Slides. You can tweak it in moments to reflect the latest information, ensuring you always have a comprehensive comparison at your fingertips.
$0.99 – Purchase Checkout
Added to cart







