Showcase Trends with Colorful Step Chart
Product Description
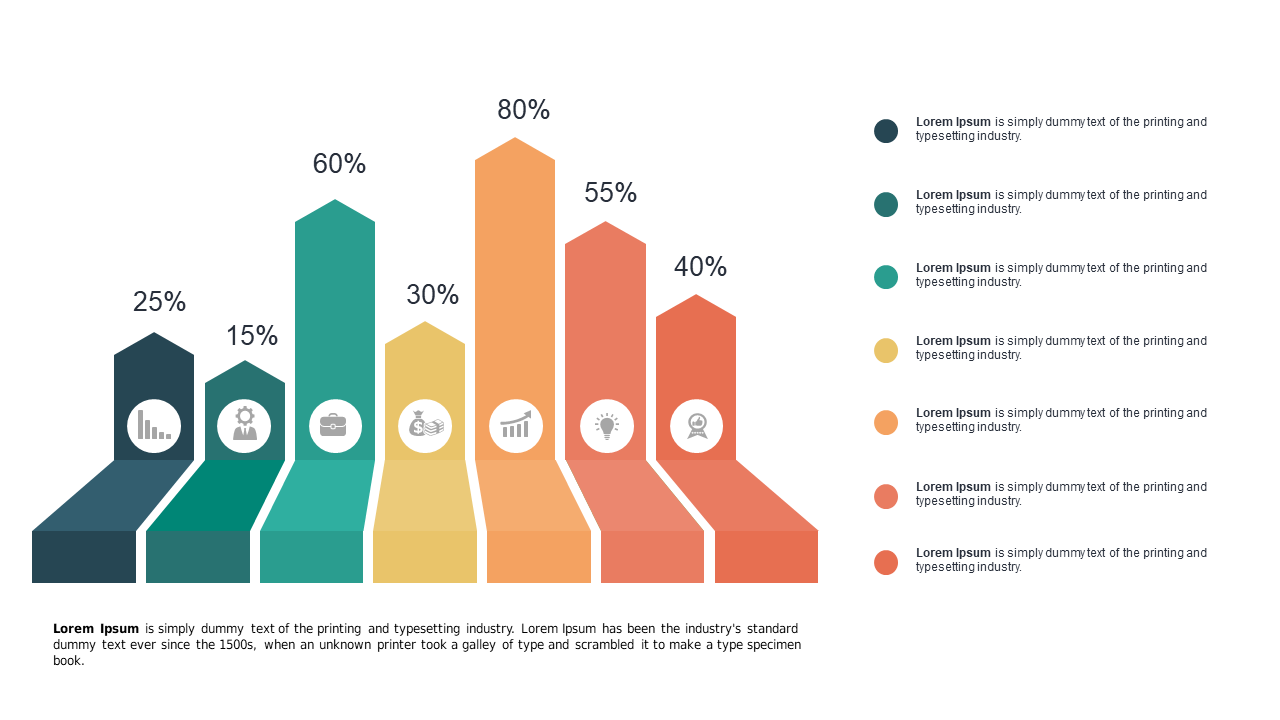
Presenting complex trends can often lead to confusion among your audience, especially when the data isn’t visually engaging. This colorful step chart simplifies your data presentation by clearly illustrating trends while also maintaining a lively aesthetic that captures attention.
You’ll make those critical comparisons easier to understand and remember. Perfect for business analysts, marketing professionals, and product managers, this slide is ideal for quarterly reviews, market analysis meetings, or sales presentations. You’ll find it especially useful when demonstrating performance metrics or growth trajectories, allowing your audience to immediately grasp key insights.
At just $0.99, you can instantly download this slide, and it’s fully editable in PowerPoint and Google Slides. It’s designed to save you time, making your next presentation preparation easy and efficient.
$0.99 – Purchase Checkout
Added to cart







