Showcase Data Variations with Colorful Sliders
Product Description
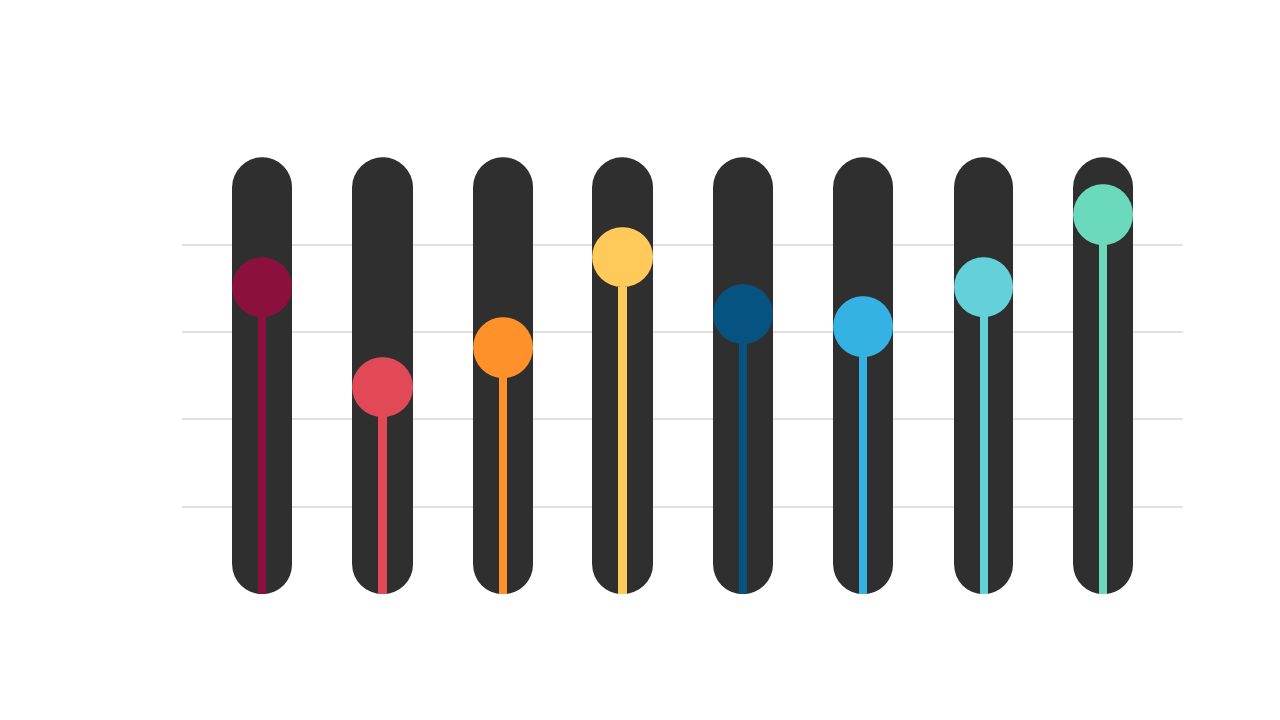
Showcasing data variations without overwhelming your audience can be a tough task. This layout featuring colorful slider controls brings clarity to your data presentation, allowing you to depict changes effectively while keeping viewers engaged.
Data analysts and business intelligence professionals will find this slide especially useful when presenting performance metrics or market trends. Whether you’re in a quarterly review, a sales meeting, or a data strategy session, it offers a lively way to convey important information.
You can grab this slide for just $0.99, available for instant download. It’s editable in both PowerPoint and Google Slides, allowing you to adjust colors and labels as needed in no time.
$0.99 – Purchase Checkout
Added to cart







