Showcase Metrics with Icon-Based Indicators V2
Product Description
Conveying data insights without overwhelming your audience can be a tough balance to strike. You want to highlight vital information while keeping your visuals clean and engaging.
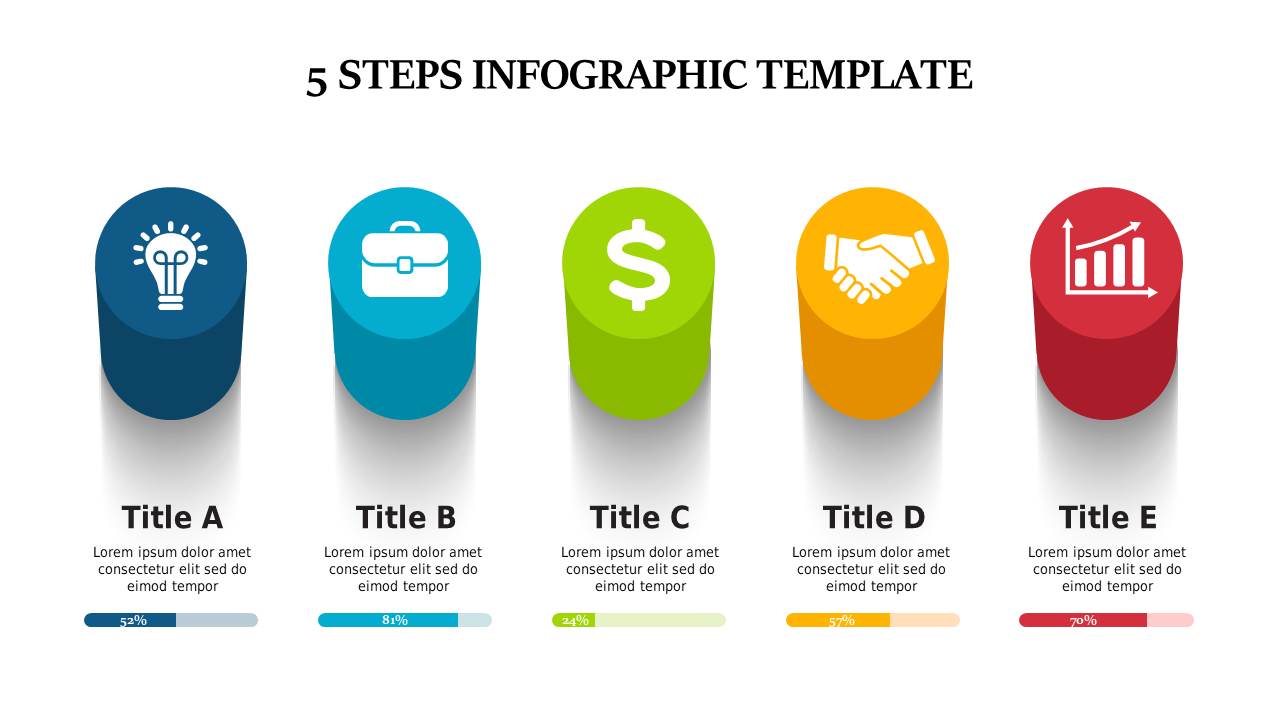
This slide helps you do just that with its simple yet striking design featuring icon-based indicators that effectively showcase your metrics. Business analysts, project coordinators, and educators will find this slide useful for quarterly reports, academic presentations, or team meetings. The clean layout ensures that your audience can easily digest the information, allowing you to maintain their attention and convey your message effectively.
At just $0.99, this slide is available for immediate download and can be easily edited in both PowerPoint and Google Slides. You’ll have it customized and ready to present in just minutes.
$0.99 – Purchase Checkout
Added to cart







