Present Data Clearly with Circular Percentages Layout
Product Description
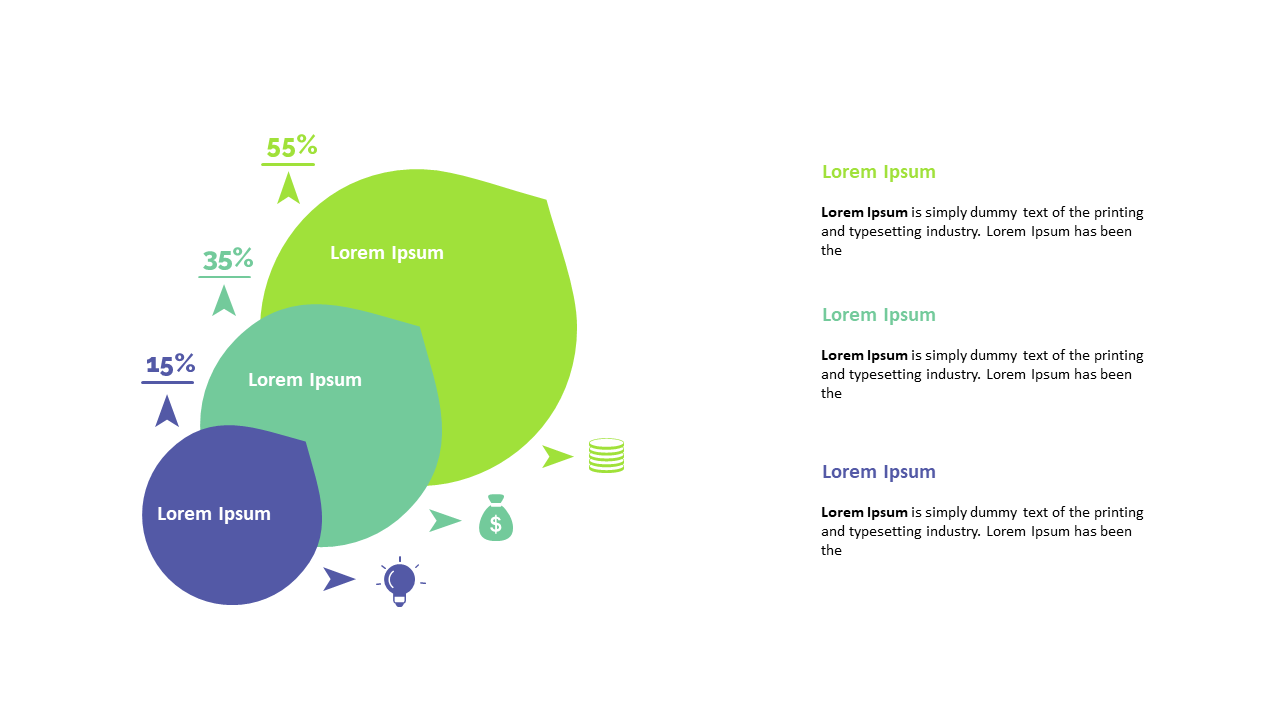
In our fast-paced work environments, presenting data clearly can be a daunting task that often leads to misunderstandings. The Circular Percentages Slide offers a vibrant and eye-catching way to display your results, keeping your audience engaged while clearly communicating crucial data points.
This layout is perfect for data analysts and marketing professionals who need to present results during team briefings or board meetings. It shines during performance assessments, where precise data visualization is key to making informed decisions based on your findings.
For only $0.99, this slide is available for instant download and can be easily edited in both PowerPoint and Google Slides. Quickly adapt the colors and percentages to match your data and get your presentation ready within minutes.
$0.99 – Purchase Checkout
Added to cart







