Summarize Marketing Data with Colorful Chart Infographic
Product Description
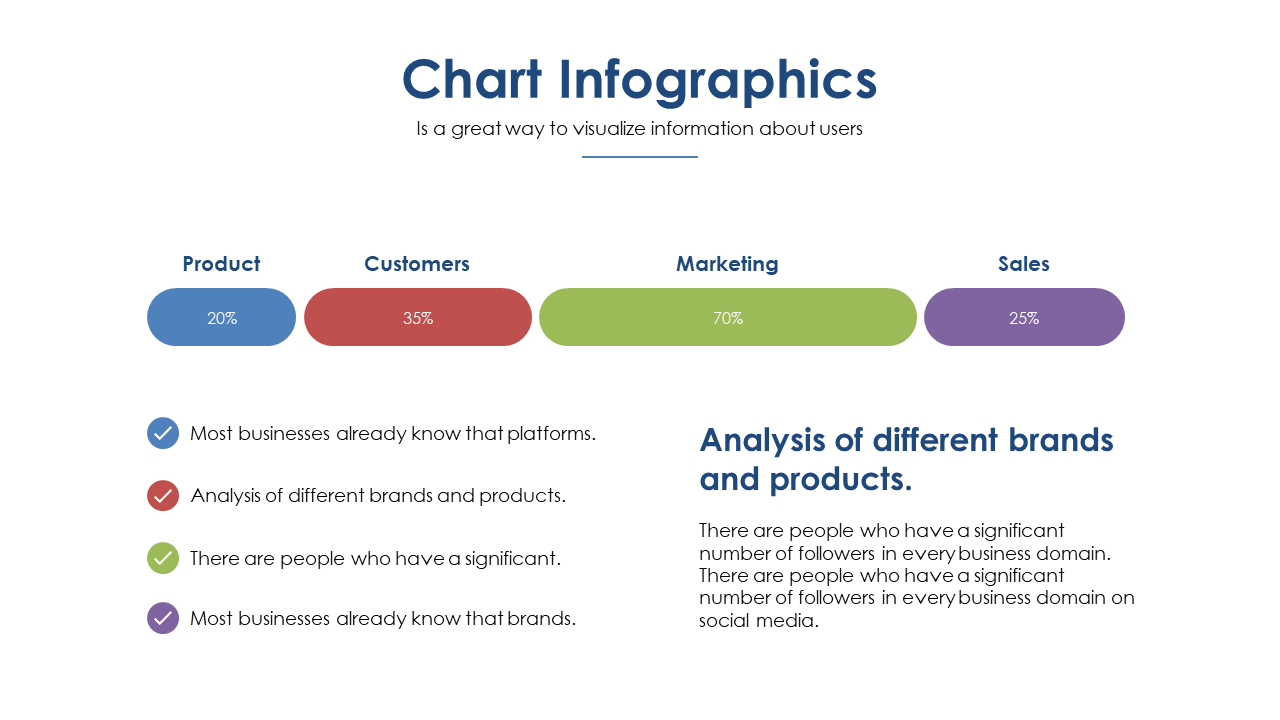
Finding the right way to present complex marketing data can often feel overwhelming. You want your audience to grasp the key insights without sifting through endless spreadsheets, and this colorful chart infographic addresses that need perfectly by making important data visually appealing and accessible.
Marketing analysts, digital marketers, and brand managers can use this slide in team meetings, client presentations, or during strategy sessions. Whether you’re analyzing campaign performance or presenting market research results, this slide helps clearly communicate your findings, making it easier for everyone to engage with the data.
Available for just $0.99, this slide is ready for you to download instantly. It’s fully editable in PowerPoint and Google Slides, ensuring you can tailor it to fit your needs in just minutes.
$0.99 – Purchase Checkout
Added to cart







