Visualize Trends with Colorful Bell Curve
Product Description
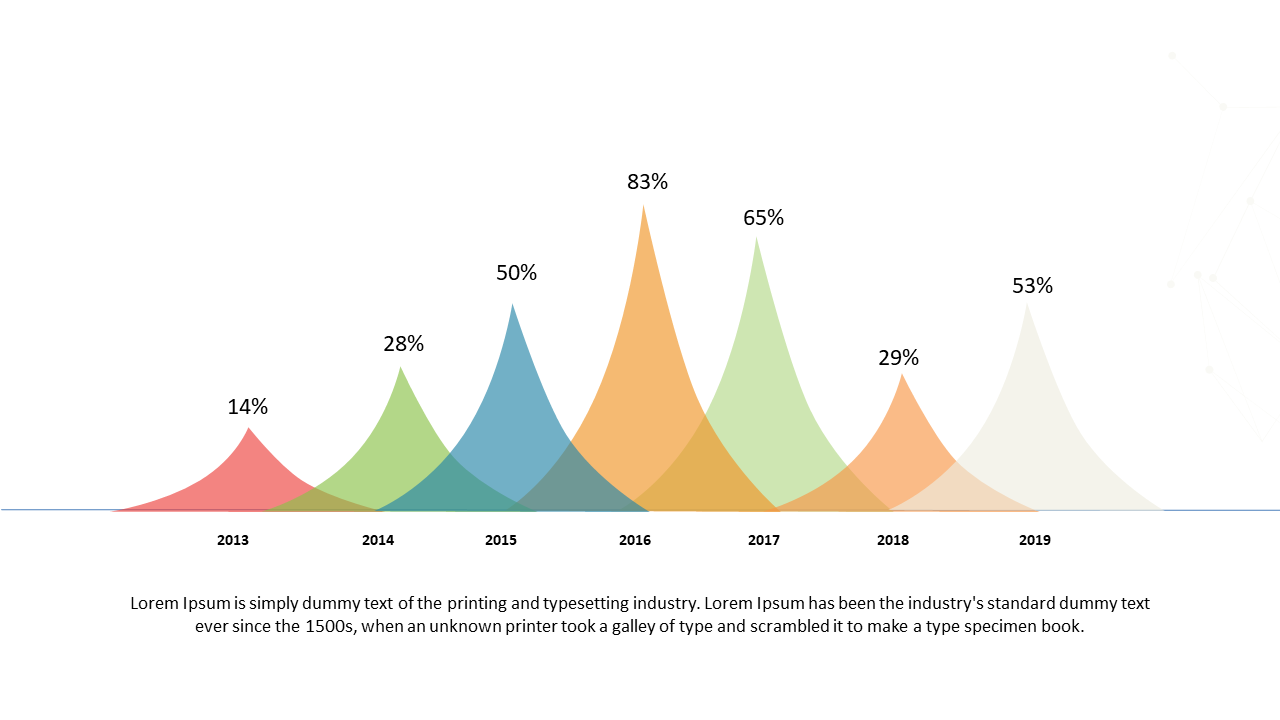
Presenting complex data trends can often feel like trying to decipher a foreign language for your audience. With this vibrant bell curve design, you can easily communicate essential insights, making it simpler for your listeners to grasp what you’re conveying. The colorful gradient not only captures attention but also clarifies your message, allowing data to be understood at a glance.
This slide is perfect for data analysts and marketers who need to present consumer behavior trends during quarterly reviews. It’s also highly effective for researchers or educators aiming to illustrate statistical distributions in a classroom setting.
Whether you’re in finance, sales, or academia, this slide delivers what you need to engage your audience effectively. At just $0.99, you can instantly download this slide and start customizing it right away. It’s easy to edit in both PowerPoint and Google Slides, ensuring you can make it your own in no time.
$0.99 – Purchase Checkout
Added to cart







