Visualize Growth with Colorful Progress Indicators V2
Product Description
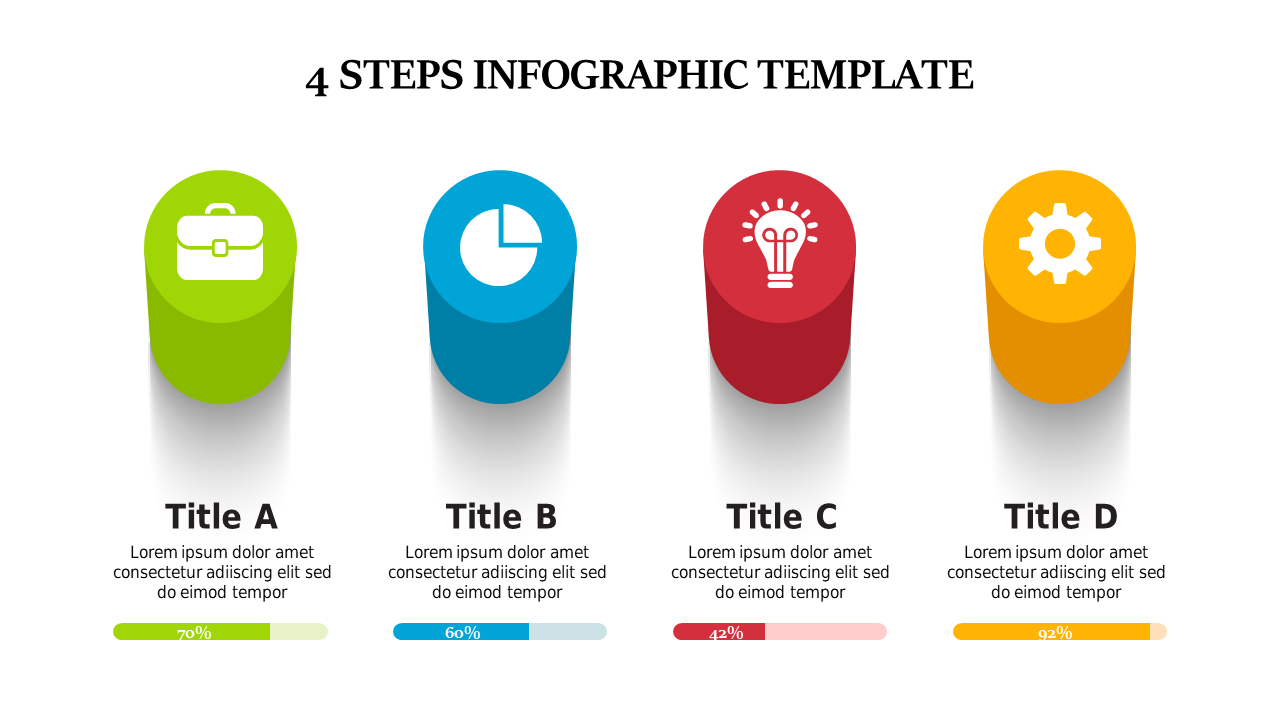
In a competitive business landscape, showcasing growth effectively is crucial for making an impact. This vibrant Colorful Progress Indicators V2 slide provides an engaging way to represent your data, allowing you to convey complex information in a straightforward manner.
With bright visuals, you can communicate progress that resonates with your audience. Business intelligence developers, marketing specialists, and sales teams can use this slide in growth strategy presentations, performance reviews, or client briefings. It’s particularly useful for those needing to illustrate key achievements and future goals in a way that captivates and informs.
For only $0.99, this slide is available for instant download and is easily editable in PowerPoint and Google Slides. Get it ready for your next presentation in just minutes.
$0.99 – Purchase Checkout
Added to cart







