Visualize Client Feedback with Bar Charts
Product Description
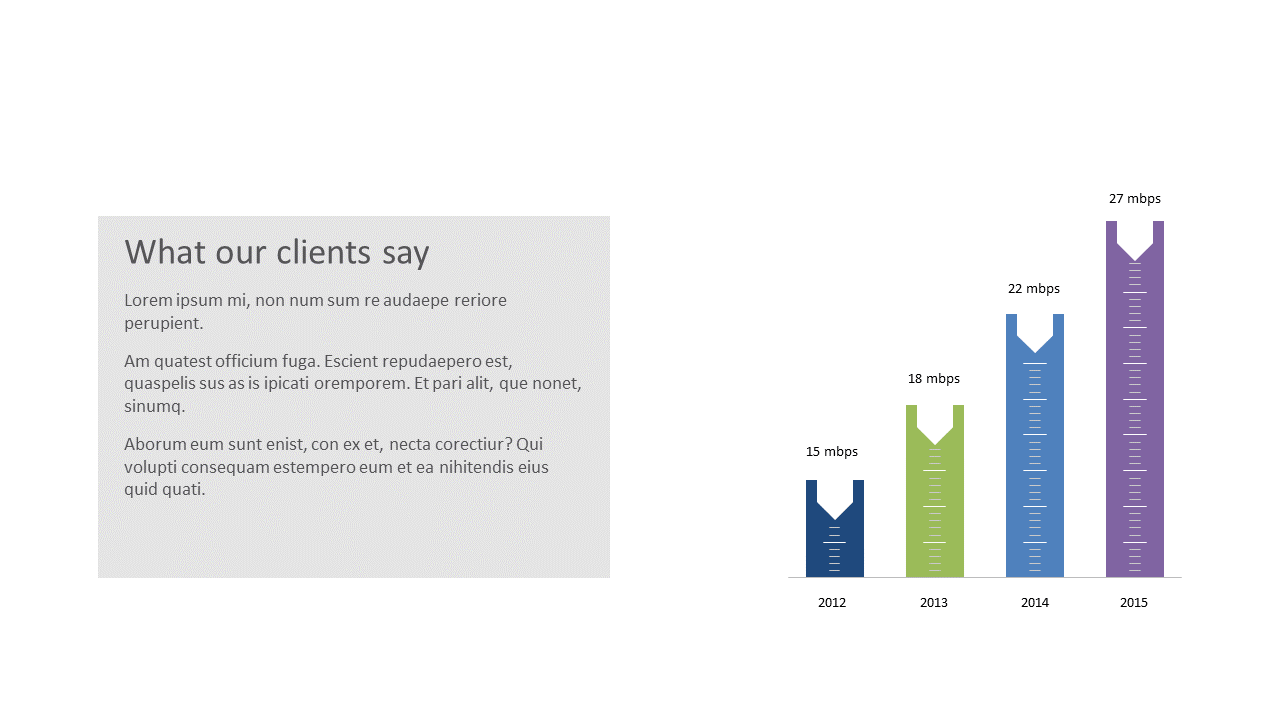
Illustrating client feedback can quickly become overwhelming, especially when trying to blend qualitative insights with quantitative data. This slide provides a clear way to visualize testimonials alongside a bar chart that tracks trends over several years. The design ensures that both the numbers and the voices of your customers are effectively communicated.
Marketing directors and product managers will appreciate this slide during presentations that require a deep dive into customer satisfaction trends. It’s also ideal for business consultants sharing insights with clients during reviews.
This engaging format helps you present a comprehensive view of client feedback without losing clarity. Offered at just $0.99, this slide is ready for instant download and easy editing in PowerPoint or Google Slides. You’ll be equipped to present your findings in a compelling manner in just a few minutes, ensuring your message resonates with your audience.
$0.99 – Purchase Checkout
Added to cart







