Visualize Metrics with Circular Progress Indicators
Product Description
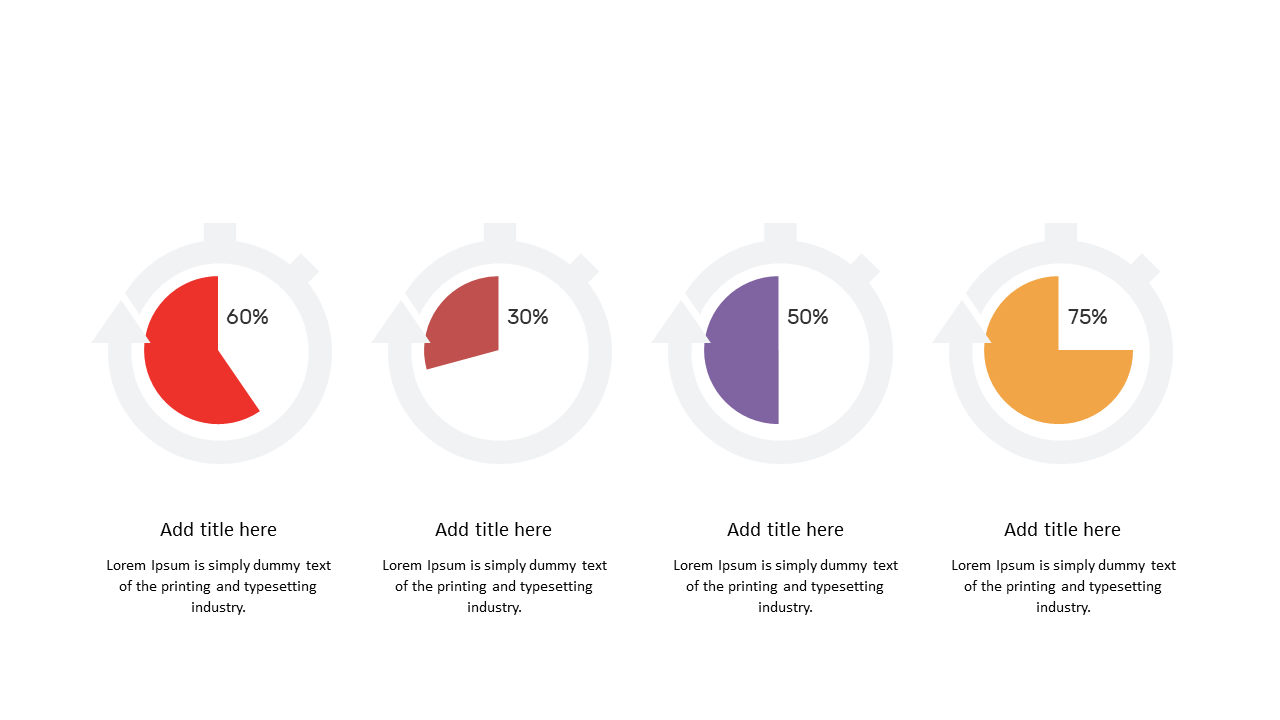
Struggling to present your metrics in a way that’s both clear and engaging is a common challenge in many professions. This slide features four circular progress indicators that visualize your key performance metrics, helping you strike the right balance between accuracy and appeal.
You’ll make your data not just informative, but also compelling. This slide is perfect for analysts, project managers, and team leaders during performance reviews, progress updates, or strategy sessions. The visual layout allows you to present targets, achievements, and progress updates in a way that keeps your audience invested and informed.
At only $0.99, this slide is ready for instant download and is fully editable in PowerPoint and Google Slides. Editing is a breeze, empowering you to customize your presentation without hassle and in no time.
$0.99 – Purchase Checkout
Added to cart







