Present Data with Circular Progress Indicators
Product Description
In a fast-moving work environment, clearly communicating key metrics can be the difference between making informed decisions and losing insight. You want to ensure that your audience can grasp critical information quickly without getting bogged down in complexity.
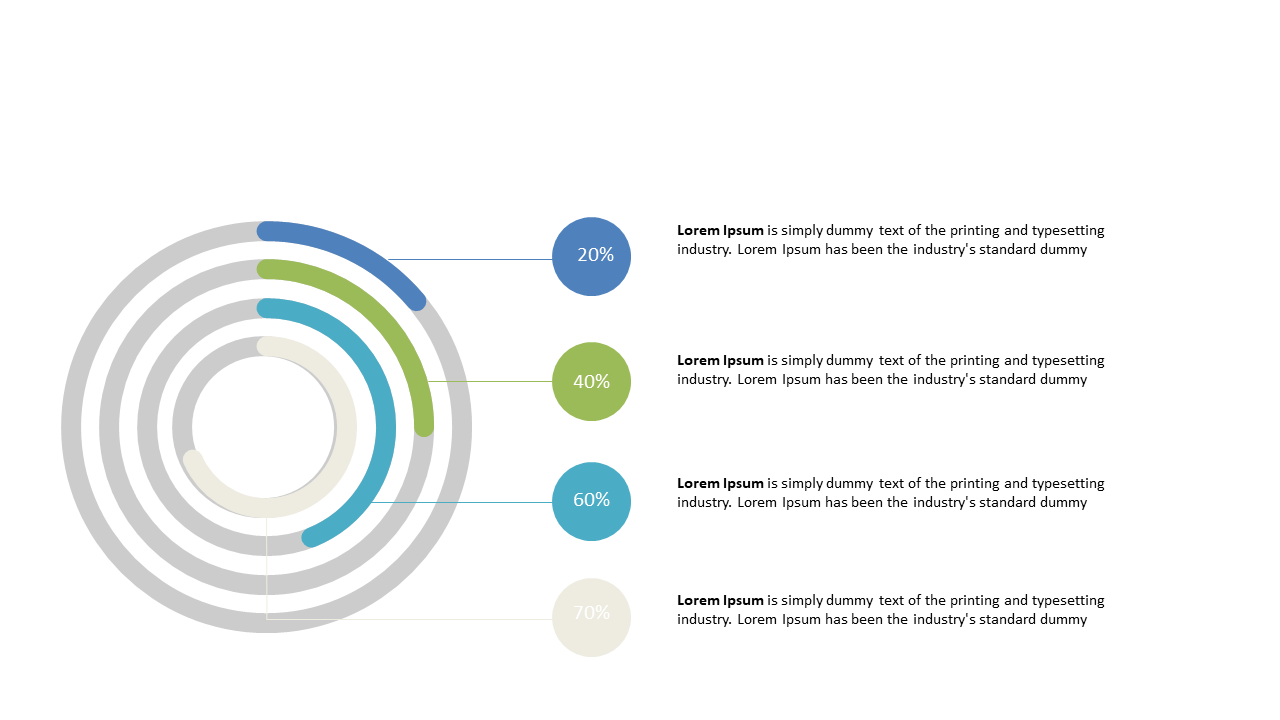
This slide features circular progress indicators that present data in a visually engaging manner. Business analysts can use this layout to summarize project completion rates during team meetings, while product managers may find it beneficial for reporting on feature rollouts. It’s also fitting for executives reviewing departmental performance at a glance in strategic planning sessions.
At just $0.99, this slide is available for instant download and can be tailored quickly in PowerPoint and Google Slides. Get it ready for your next presentation in just minutes and wow your audience.
$0.99 – Purchase Checkout
Added to cart







