Showcase Metrics with Circular Progress Indicators
Product Description
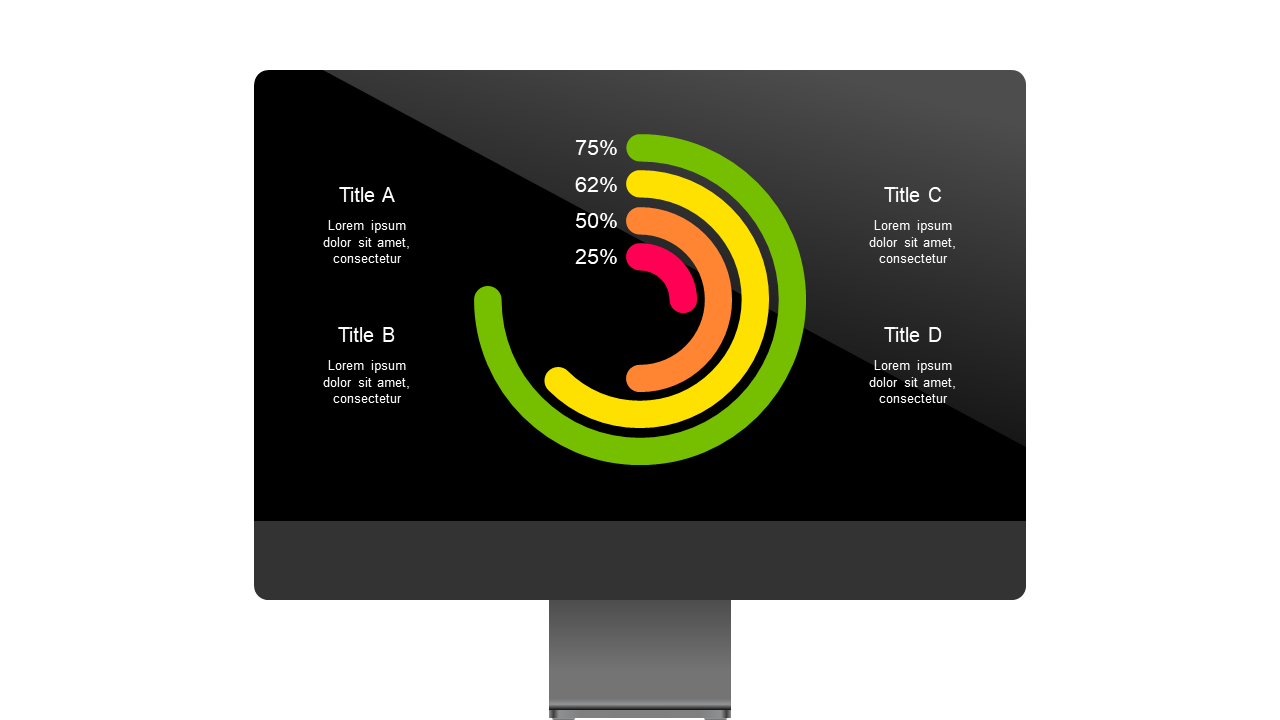
It can be tough to convey progress when you have multiple performance metrics to report on. Finding a concise way to represent your achievements is essential for keeping your audience engaged.
These circular progress indicators simplify that task, presenting your data in an eye-catching format that encourages understanding and discussion. This slide is perfect for project leads discussing project milestones, HR professionals reporting on employee performance metrics, or product managers evaluating product development stages. Whether you’re presenting to your team or external partners, this layout helps you clearly communicate how far you’ve come in your objectives.
Available for just $0.99, this slide can be downloaded instantly and is fully editable in both PowerPoint and Google Slides. Customize it with your data in a matter of minutes, allowing you to focus on what truly matters: delivering your message effectively.
$0.99 – Purchase Checkout
Added to cart







