Present Progress with Circular Indicators and Percentages
Product Description
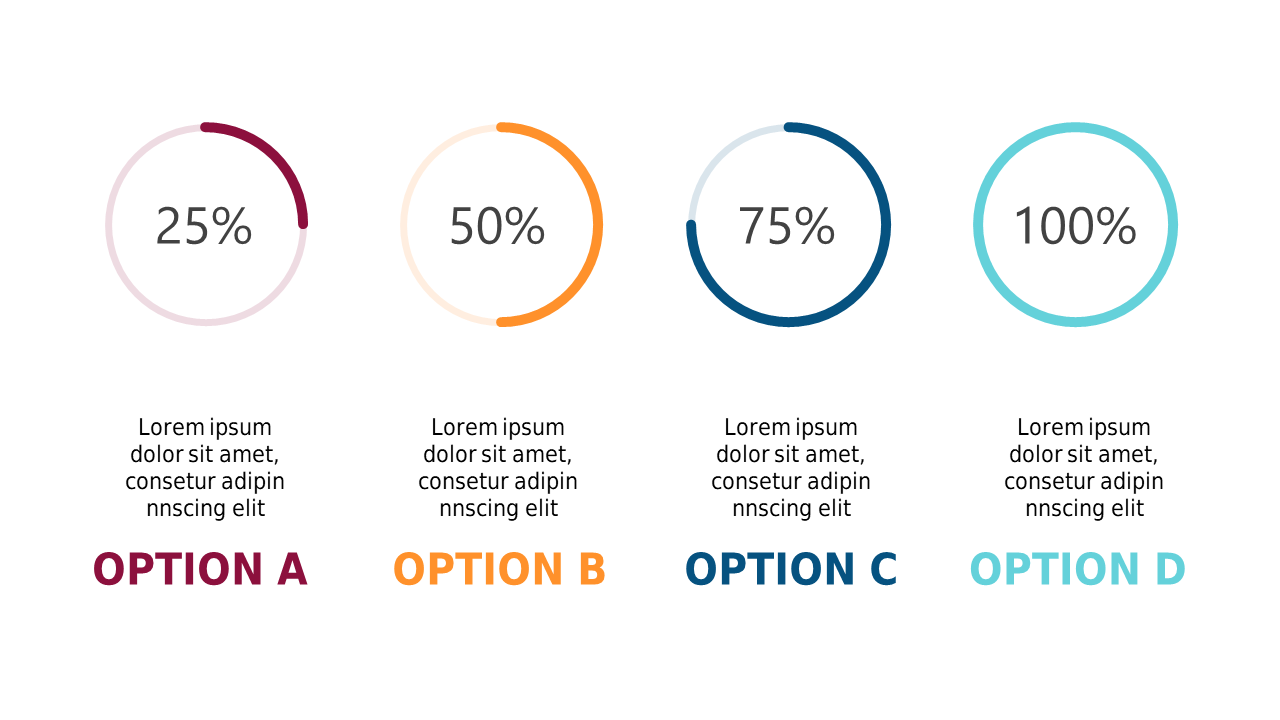
Communicating progress can often become dry and unengaging, making it hard for your audience to connect with your data. A layout featuring circular progress indicators allows you to present completion rates and survey results in a visually appealing way.
This makes it easier for your audience to understand your performance metrics at a glance. Data analysts, project managers, and marketing professionals will find this template especially useful during performance reviews or update meetings. Picture yourself using this layout to present a project’s milestones or survey feedback results, turning raw numbers into compelling visuals that foster discussion and understanding.
Get this slide for just $0.99, and you’ll have an instantly downloadable, editable resource ready for use in PowerPoint and Google Slides. Enhance your presentations today and make your data speak volumes.
$0.99 – Purchase Checkout
Added to cart







