Showcase Achievements with Circular Progress Indicators
Product Description
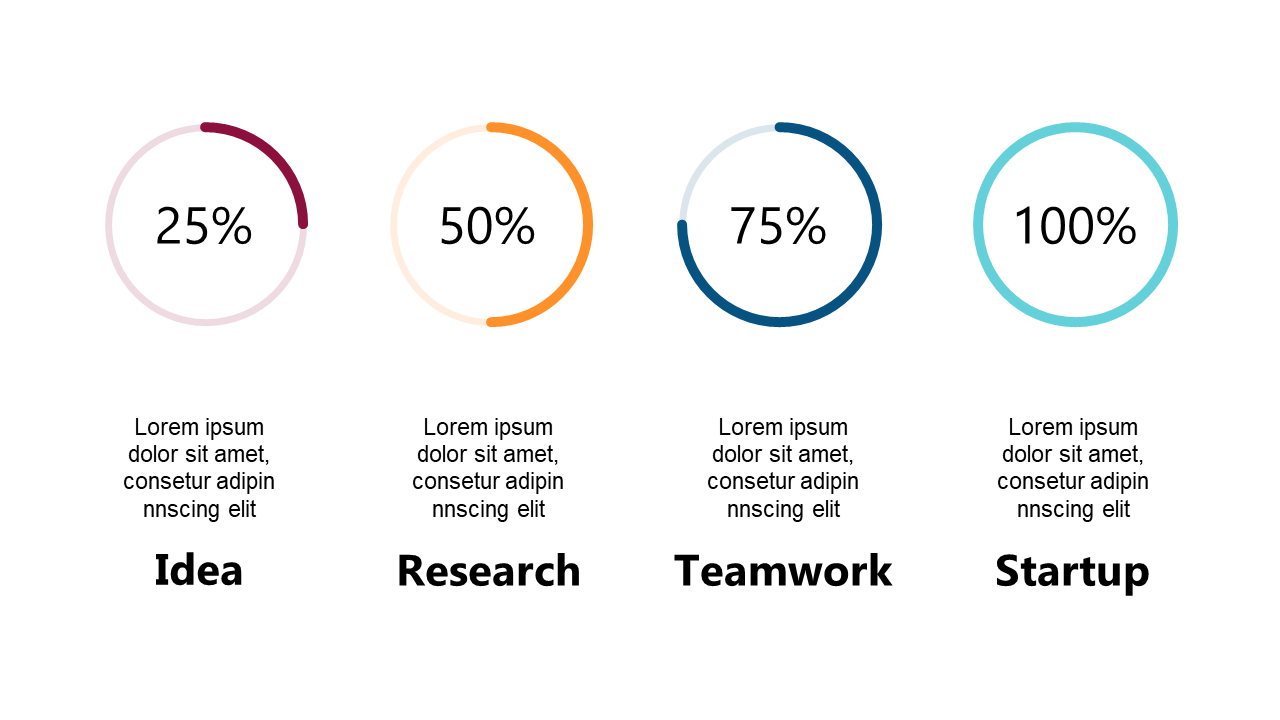
Showcasing your achievements can sometimes fall flat without the right visuals to support your narrative. If you’re looking to highlight key milestones or project phases effectively, this circular progress indicator slide is designed to solve that concern.
The indicators paired with descriptive labels create a visually appealing way to represent your progress. This slide is perfect for project managers sharing updates in team meetings, sales executives presenting quarterly results, or any professional who needs to highlight progress in a compelling way. Use it during client presentations, performance reviews, or strategy sessions to make a strong impression.
At just $0.99, you’ll receive this impactful layout ready for instant download. Easily edit it in PowerPoint and Google Slides, allowing you to customize progress percentages and descriptions to fit your specific project needs in just minutes.
$0.99 – Purchase Checkout
Added to cart







