Visualize Progress with Circular Indicators and Labels
Product Description
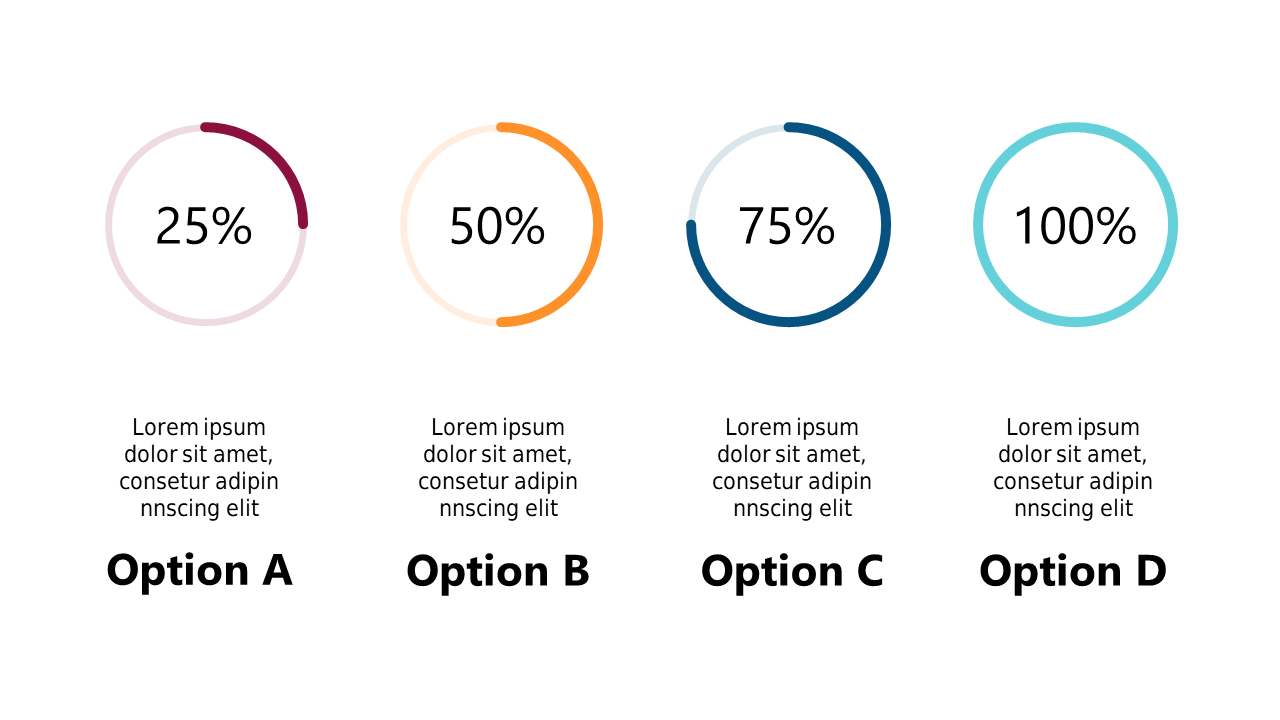
Communicating your progress effectively is crucial to keeping your team and stakeholders informed, yet it can be hard to present this information in a way that truly captures attention. This slide offers a solution by utilizing circular progress indicators that visually display achievement levels, making your data not just informative, but engaging as well.
Great for operations managers reviewing project stages, marketing teams showcasing campaign milestones, or anyone needing to illustrate achievements clearly. Use it in performance briefings, strategic planning meetings, or when presenting project updates to clients to enhance understanding and retention.
For only $0.99, this slide is available for immediate download and can be easily edited in PowerPoint and Google Slides. With customizable elements, you can adapt it to suit your needs and deliver your progress updates quickly and effectively.
$0.99 – Purchase Checkout
Added to cart







