Visualize Data Progress with Circular Indicators
Product Description
Communicating data progress effectively can feel overwhelming, especially when you’re under time constraints or facing a less-than-engaged audience. You need a solution that allows you to present updates clearly without losing your audience’s attention.
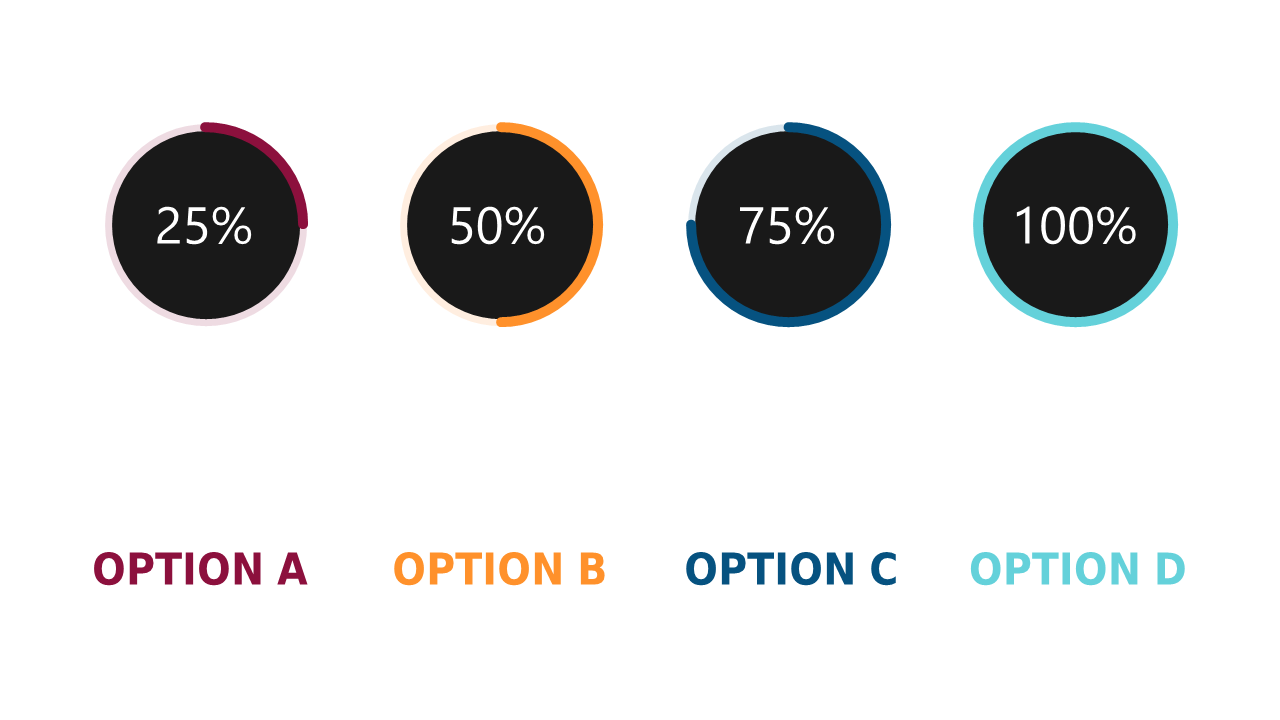
These circular indicators simplify that process, providing an eye-catching way to display percentage values. This slide is perfect for project managers presenting quarterly results, marketing professionals sharing campaign progress, or sales teams discussing performance metrics in client meetings. Regardless of your industry, these visuals help you quickly communicate key information, making it easy for your audience to understand where you stand.
For just $0.99, this slide is ready for you to download instantly. It’s fully editable in both PowerPoint and Google Slides, allowing you to customize it to fit your specific needs with ease.
$0.99 – Purchase Checkout
Added to cart







