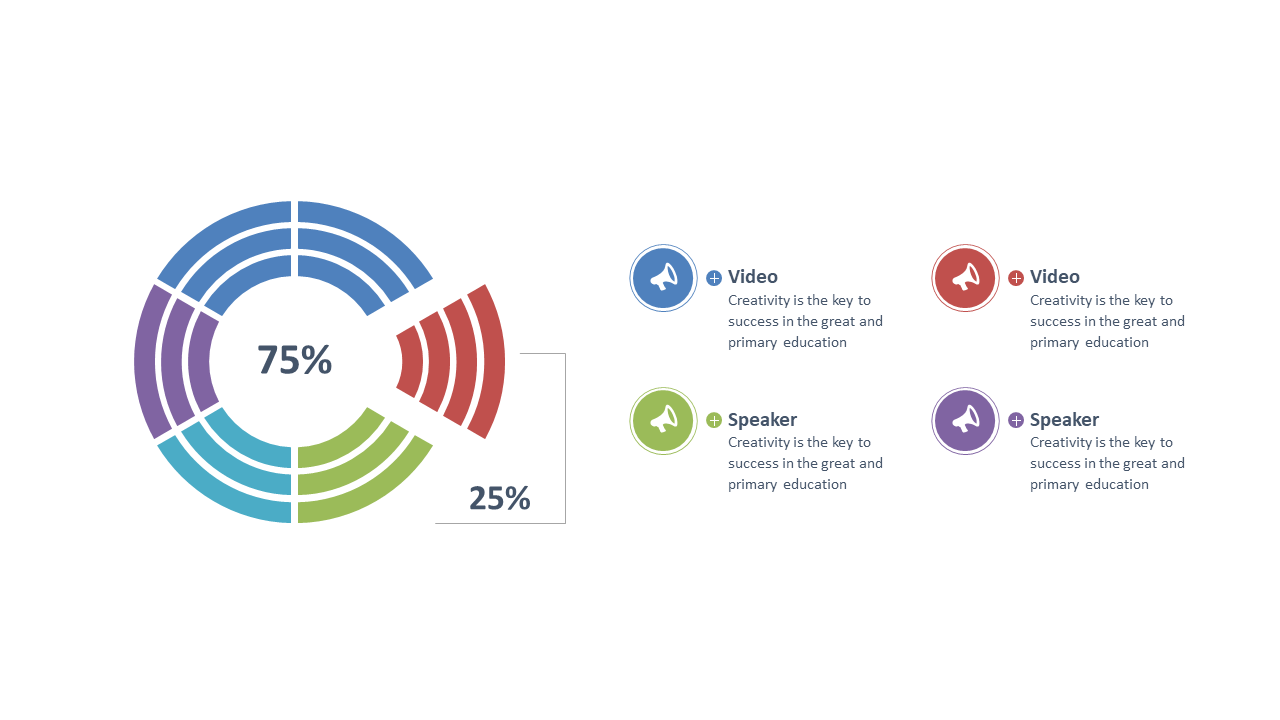
Visualize Metrics with Circular Progress Chart
Product Description
When it comes to presenting metrics, making data digestible is a major challenge. Overwhelming your audience with numbers can lead to confusion rather than insight.
This circular progress chart transforms data into a straightforward visual, enabling you to highlight key figures and details effectively. If you’re a data analyst reporting quarterly results, a sales manager discussing performance metrics, or a project coordinator summarizing progress, this slide is right for you. It’s ideal for team meetings, executive briefings, or any scenario where you need to make your data accessible and engaging.
For just $0.99, you can download this slide instantly and edit it to fit your metrics in minutes. It’s fully compatible with PowerPoint and Google Slides, making it easy to incorporate into your presentations.
$0.99 – Purchase Checkout
Added to cart







