Effective Data Visualization with UK Map and Indicators
Product Description
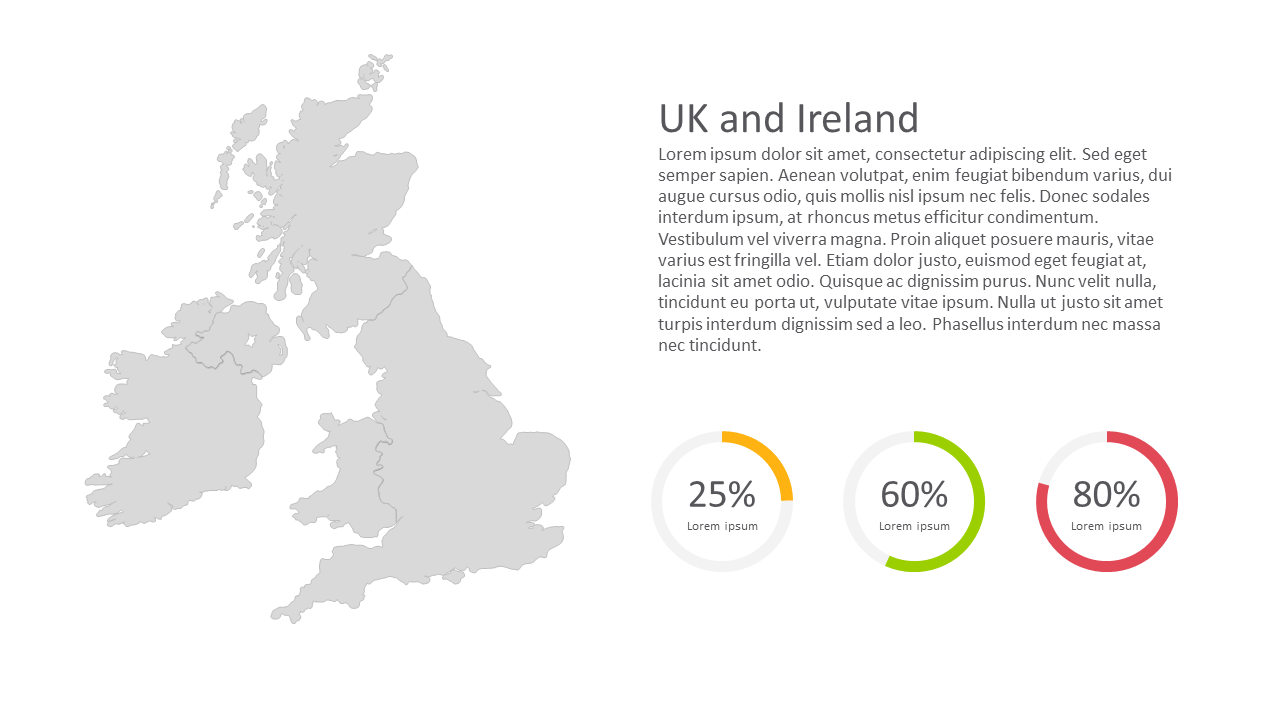
In today’s fast-paced corporate landscape, presenting data in a clear and intuitive manner is more important than ever. When you’re dealing with critical metrics, the last thing you want is for your audience to be confused or overwhelmed. This slide featuring a detailed UK map with circular percentage indicators helps you communicate essential data points clearly and effectively.
This slide is perfect for data analysts in finance, project managers coordinating cross-regional projects, or government officials needing to present key statistics. Imagine using it in a departmental meeting to showcase performance across the UK and Ireland, making your insights both accessible and impactful.
For only $0.99, you can download this slide instantly and make it your own. It’s fully editable in both PowerPoint and Google Slides, ensuring
you can customize it quickly to suit your specific needs.
$0.99 – Purchase Checkout
Added to cart







