Communicate Metrics with Circular Percentage Chart
Product Description
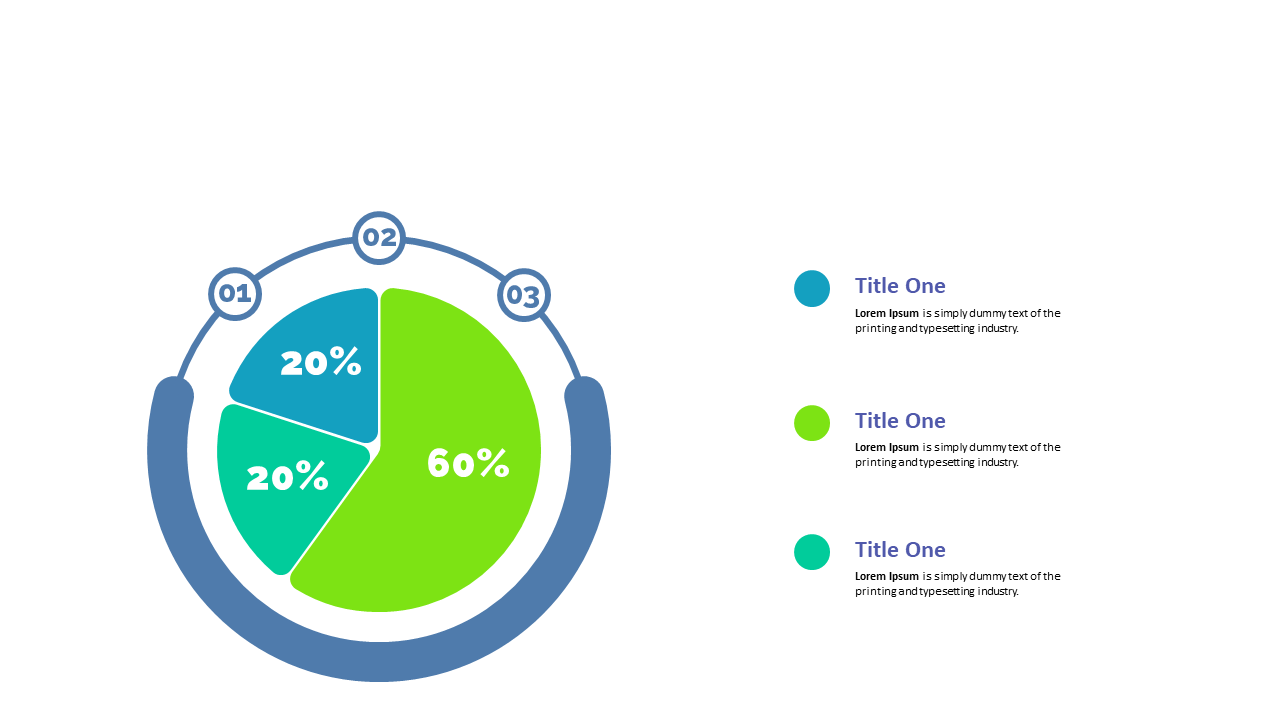
Presenting metrics can be tricky when clarity is essential for decision-making. This circular percentage chart simplifies complex information into distinct segments, making it easy for your audience to grasp key metrics at a glance.
This slide is perfect for performance analysts presenting departmental results, marketing teams sharing campaign effectiveness, or executives summarizing company performance. Use it effectively in board meetings, strategy sessions, or client reports to communicate essential metrics clearly.
For only $0.99, you can download this slide right away and edit it in PowerPoint or Google Slides. Customize it quickly to fit your data presentation needs and be ready in no time.
$0.99 – Purchase Checkout
Added to cart







