Showcase Key Metrics with Circular Display
Product Description
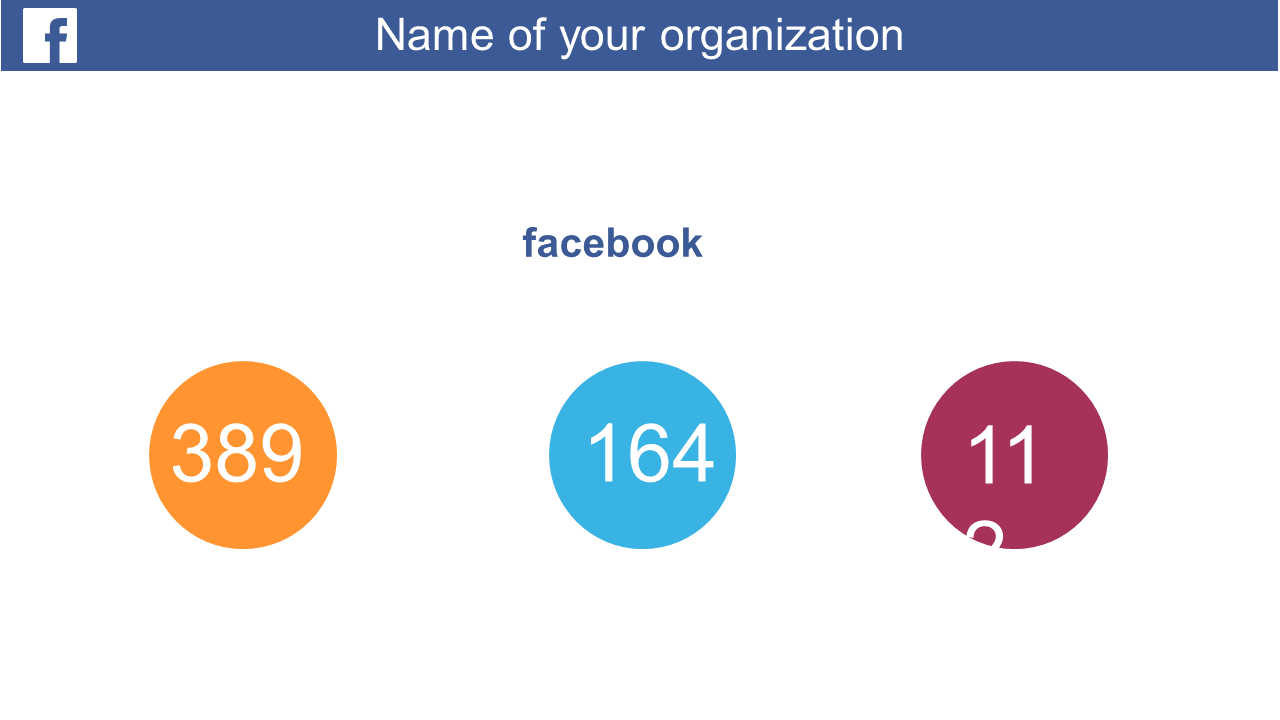
Do you find it challenging to display your key performance metrics in a way that stands out? This circular display layout allows you to present important data points clearly and attractively, drawing attention to the numbers that matter most.
It takes the stress out of data visualization. Business analysts, marketing professionals, and team leaders will find this slide invaluable for performance reviews, project updates, or marketing presentations. Use it to highlight your achievements and showcase your brand’s impact in a visually striking format.
For just $0.99, this slide is available for instant download, and you can easily edit it in both PowerPoint and Google Slides. Customizing it to reflect your brand colors and specific metrics is quick and straightforward, making your preparation a breeze.
$0.99 – Purchase Checkout
Added to cart







